October 2026 Market Outlook
Following up on the theme from our July Outlook, we expressed great skepticism that oil prices, then hovering around $70, were stabilizing. We cautioned that higher energy prices were likely part of the new structural landscape. Today, WTI Crude is $101.84 per barrel—up over 40%. Oh, and still no “deal” with Iran.
But our focus now is on another rising macroeconomic force that has captured most investors’ attention: rising interest rates. We spoke recently (late summer, as we recall) with a client hyper-focused on how the coming election might impact the markets. These conversations are frequent in election years—with fans on both sides imagining repercussions if their “team” doesn’t win the upcoming game. Our response is to always deemphasize political elections when thinking about and managing investment portfolios. Always, every election period. We suggested the client focus on interest rates if they really wanted (or needed) a boogeyman.
Investors understandably have recent and uncomfortable memories of 2022 when it comes to interest rates. That year, the Barclays Aggregate Bond Index fell by over 13%, making it the worst year on record for this 40-year-old benchmark. Our discussion will compare 2022 and 2026 but mostly contrast them. One contrasting feature is how we’re thinking about the current rate regime going forward. In short, and like our outlook for energy prices, we expect higher rates for longer, whereas most expected sharply lower rates and a possible recession back then—a recession which never came.
The sharp rise in interest rates four years ago was clearly the market’s response to significant fiscal and monetary policy mistakes. It was also the beginning of an unraveling of over a decade of monetary decadence, which saw the Fed’s balance sheet balloon through monetary acrobatics from less than $800 billion shortly after the Dot Com crash, to nearly $9 trillion in 2022…all done to suppress the long end of the yield curve, keeping mortgages unnaturally cheap as well as driving financial asset prices significantly higher.
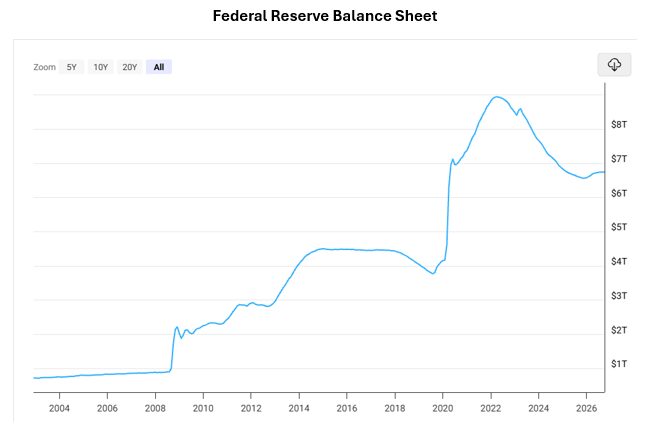
Source: https://www.macrotrends.net/3003/fed-balance-sheet
Millionaires were made into billionaires in many cases simply by US monetary policy. The fiscal mistakes were many over the previous decade, as evidenced by today’s $40 trillion national debt. Inflation ignited with particular ferocity following the massive fiscal stimulus in 2022, which injected hundreds of billions of dollars into an already recovering economy—with the promise of trillions more in the future.
The monetary policy mistake was to not counteract this fiscal prolificacy, and to delay rate hikes to counter naturally rising inflation with the “inflation is transient” narrative. The Fed was clearly behind the curve—inflation jumped as high as 9.1% by mid-2022.
We encouraged our clients three years ago to forgo the tempting rates offered on cash instruments and actively invest in the bond markets, given the Fed’s belated but aggressive catch-up efforts to bring inflation down. Sure enough, our most widely held bond funds had returns of 9% to11% in 2023, and three-year average returns of about 7%—which includes this year’s subdued returns.
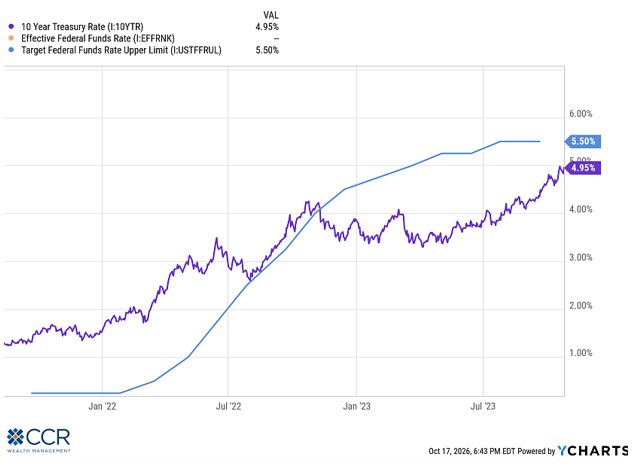
Today has similarities—but even more differences from the bond-rout of 2022, and perhaps more to tell us (if we’re willing to listen) about equities. In August of 2021, the 10-year Treasury yield was as low as 1.19%. Two years later, this same benchmark yield rose 318% to 4.98%. Over this same period, the target Fed Funds rate (at the time helmed by Chairman Jerome Powell) went from 0.25% to 5.50%--a 2,100% increase. Hence, the bond market collapse of 2022.
Enough about history.
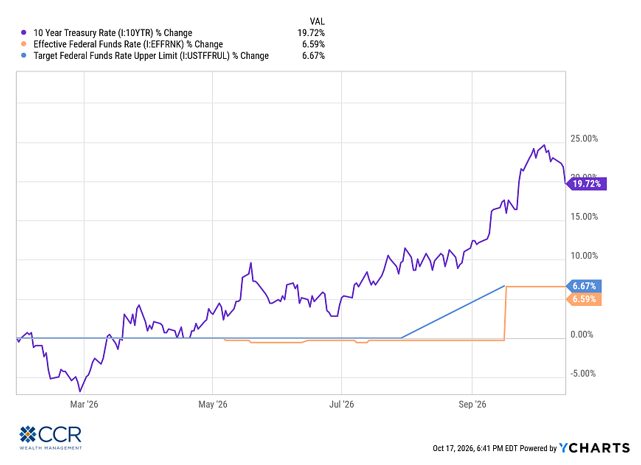
While interest rates across the yield curve have risen sharply in 2026, we note that the rise in the 10-year yield, by contrast, is ~20%, whereas the Fed Funds rate today has risen only 25 basis points year-to-date, or ~7%.
Our own Strategic Model bond portfolio is flat year-to-date against the Bloomberg Index, which is down 1.63%, as we write. Some of this delta involved taking the rise in rates seriously back in May and reducing the portfolio duration. Some of it is purely due to diversification, which we’ve been harping on for years now (our emerging markets bond allocation is up over 10% year-to-date). In any event—this is a far cry from the pain we felt in 2022. It is, rather, a “lost year” in the bond allocation—so far—and not the rout we experienced a few years ago. Moreover, as rates are expected to be “higher for longer”—our own conversation with asset managers confirms that yields in the funds are increasing—often along with credit quality.
This leads us to point out another contrast with 2022: This is an excellent environment for savers, investors, and particularly retirees. And we think it lasts longer than the spike in ‘22. The “pain” of a flat return in your bond portfolio on a year-to-date basis we can empathize with. But you come out the other end with higher yields (higher income) across the bond portfolio. In fact, the fund we sold in our Strategic Model in May to park in a shorter duration ETF allocation (a 1.69% total return benefit as we write) allows us to reverse that trade and reinvest back into the fund we sold, which, according to the managers of the fund, had a 5.37% yield when we exited in May (and was 43% Treasuries), and now has a 5.70% yield (and is 63% Treasuries). Higher quality, higher yield!
It’s worth repeating; investors have experienced a “lost year”—not a rout in the bond market. The future foretells higher rates for longer, benefiting investors who save and look for income from their portfolios.
Higher for longer is theorized due to the reason rates have shot up this year, another contrast to 2022. As mentioned, fiscal and monetary policy mistakes take most of the blame for that episode. With long historical precedent, the common sequence of events is that the Fed raises rates to fight inflation (or attempt to slow the economy); they overshoot, recession ensues, and the Fed reverses course, lowering interest rates to restimulate the economy. Many, including us, predicted Fed easing after the 10-year Treasury yield topped out in late ’22. We had an inverted yield curve, and, well, long historical precedent. Of course, recession never came, but the Fed did cut. And bonds rallied at last.
Today’s higher rates, though, have a multitude of causes, and they are more intractable than a simple Fed decision to lower the Fed Funds rate (a decision the Fed is not leaning toward now anyway).
The US national debt is $40.3 trillion.
The US Treasury must increase the supply of Treasuries to absorb this increasing debt. Increased supply = decreased prices of these bonds, which equals higher yields. Additionally, as total debt-to-GDP ratios rise past historic milestones, investors’ view of the true nature of this “risk-free” debt changes, and higher yields are required by the bond market (“bond vigilantes”). Also—as government debt issuance expands at higher yields, a crowding-out effect can occur in the private (corporate) bond market as higher costs of capital are required to compete with “safe” government debt.

On October 12th, the most recent US government debt sale (an auction process) cleared at a yield of 5.30% for 10-year Treasuries. The auction was met with strong demand ($108 billion in bids ) and the market let out a sigh of relief. Expect these auctions to gain increased attention from investors in the future. Weak auctions due to investor demand for higher premiums will push rates higher still.
The national debt is perhaps the single most intractable force pushing rates up. This is because spending is controlled by politicians, and we expect no politician from either party to campaign on a platform of cutting entitlement spending, roughly 66% of the US federal budget, until a crisis occurs. As it stands, under current law, there will be a 27%-33% haircut to Social Security benefits sometime between 2031 and 2033 when Social Security taxes can no longer keep up with Social Security claims. As our own Jon Lilja, ESQ., CFP®, Financial Planner, recently put it, given the recently announced COLA adjustment to Social Security of 3.6%, that 2031-33 time frame may have just been moved up. This is not a forecast—but an example of what an “emergency” might look like—because it will be political.
The AI Spending Frenzy
As with US government debt, a massive issuance of corporate debt by tech giants (about $500 billion since 2024) has flooded the market with bonds. Increased supply = decreased prices and increased bond yields. This debt is being issued to finance the build-out of data centers, chips, and power infrastructure, and what’s more, most projections incorporate trillions more through 2030.
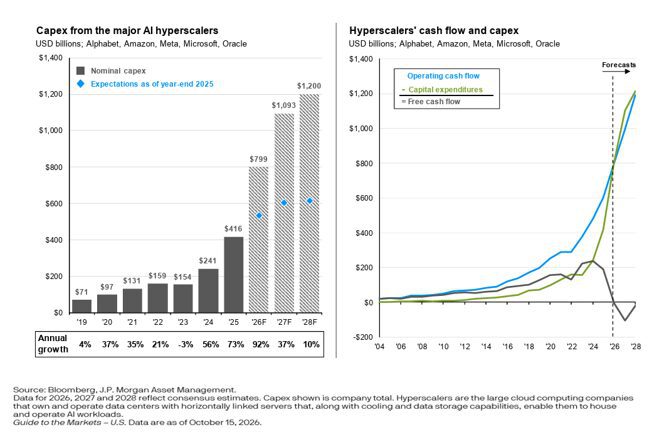
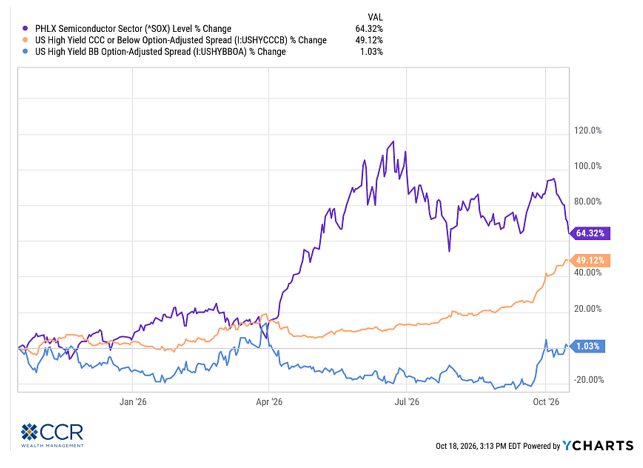
These massive debt loads are being taken on because, as we are assured by the companies borrowing, the AI revolution in productivity and return on investment will be many times the cost of capital involved in building it. If that proves true, the borrowing continues at higher rates. If that narrative begins to falter—things can get messy, as this is credit. Yields don’t necessarily fall, but credit spreads certainly widen. If revenue projections prove to have been overly optimistic against massive financial commitments already made, a “credit event” could ensue. In fact, there has been some skepticism expressed in recent months by analysts. One result has been a slide of ~24% in the PHLX Semiconductor Index since June highs, and down nearly 12% since OpenAI’s annualized revenue through September was announced on October 8th. Annualized revenue came in at $50 billion, or roughly $20 billion short of the $70 billion signaling they had been giving to the markets. Concurrent with the reaction in semiconductor stocks was a sharp rise in the Option Adjusted Spreads on CCC- and BB-rated bonds. We also know CDS (credit default swaps) spreads have risen to near record highs on even some of the largest hyperscalers with the strongest balance sheets.
The market is signaling a lack of certainty here, pushing up the yields in the credit markets.
Economic Growth/Inflation/Warsh
There’s a lot of grumbling these days. There usually is during election cycles. But we can’t deny there’s plenty to grumble about. Top of the list for us is the cost of filling the tank.
So much narrative about how badly the consumer is doing is hard to square with the evidence, though. Much of it (the narrative) stems from the fact that it is an election year. Much of it also stems from consumer surveys. As investors, we are interested in capital markets and forming the most accurate outlook for stocks and bonds possible. That said, there are fewer reliable contrarian indicators than the University of Michigan Consumer Sentiment Index (CSI).
Two charts below: The first is a five-year lookback of the Monthly data of the CSI.
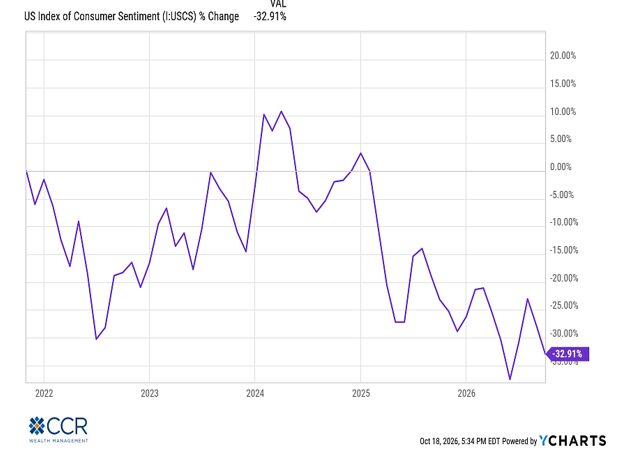
What stands out most to us is that Consumer Sentiment (according to the UofM survey) is apparently at or near a 5-year low. The Consumer Price Index came in a little hot last week at 3.7%. But as we pointed out earlier, the June 2022 CPI read was 9.10%! And yet—according to the survey, consumers feel worse about things today than they did in June of ’22.
The second chart gives us a 55-year look-back plotting the UofM survey readings against the S&P 500 peak-to-trough, trough-to-peak returns.
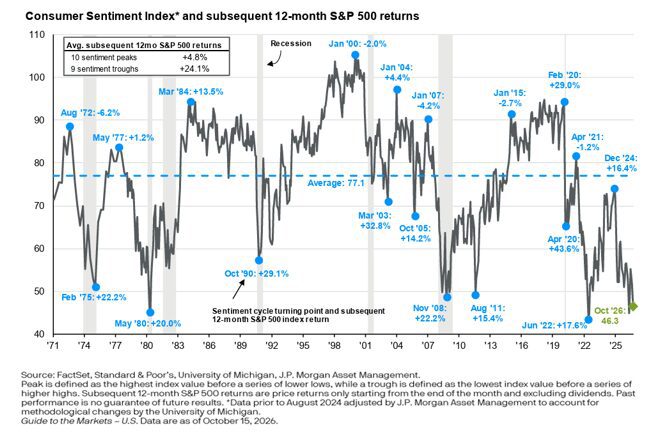
Equity returns are meaningfully better when CSI is “troughing” than when consumer sentiment is highly positive.
Jet fuel prices have gone through the roof this year, and US airfares have jumped 20%. And yet a recent interview with one of the major US carriers last week featured a resolve to keep prices up because demand has not backed off. Just how bad are things for consumers?
History would suggest that when consumers are feeling this bad, investors should aggressively load up on risk assets like stocks.
We focus on consumers because they account for ~2/3rd of GDP. In short, the US economy is growing at a moderate pace, while the unemployment rate remains in the low 4% range (low hire, low fire). This is technically “full employment”. As mentioned, plenty to complain about: gasoline prices, grocery prices, mortgage rates, etc. But none of these important metrics suggest the Fed should be cutting interest rates. Which means current rates are here to stay and could possibly represent the new “floor”.
Kevin Warsh was sworn in as the latest Federal Reserve Chairman in May. He was preceded by Jerome Powell, who was sworn in to that role in 2018. There is an ominous parallel here that each Chairman enacted their first rate hike shortly after their confirmation. But 2018 saw an October swoon in the markets after a Powell speech that hinted that the recent series of rate hikes would likely continue. The S&P 500 was up 11% at the end of September that year, but finished the year down 4.38%, losing roughly 14% since that speech. Warsh and company raised rates by 25 basis points last month. Hot CPI and PPI data since then suggest more rate hikes ahead, and the market has been wobbly in the last few weeks. These are interesting parallels, and worth mentioning in the counterbalance to generally bullish Q4 seasonality.
Lastly, Kevin Warsh, the new Chairman of the Federal Reserve, strikes us as cut from a different cloth than the last three Chairs. In a speech at Jackson Hole in August, two statements struck us as overdue in their sensibility.
1) “We should not indulge a regime in which market participants are looking primarily to the Fed for their next trade”.
and...
2) “While this summer’s inflation readings were better than expected, they do not tell me that underlying trends have meaningfully improved”.
Warsh has set out to enact certain reforms at the Fed we believe are overdue. We think there is truth in the notion that past Fed officials have been too concerned with (equity) market reactions to their every utterance. And we also agree with Warsh that there has likely been too much of this “utterance”. Few economic forecasting entities have worse track records than the Federal Reserve, which employs between 750 and 800 Ph.D. economists. While the proof lies ahead in terms of action and results, he strikes us as a Fed Chairman zeroed in on price stability—and in the long run, that’s good news for investors and consumers.
Follow us on social media for more timely content delivered directly to your news feed!