October 2023 Market Outlook
This Outlook edition will require investors to consider some truths which may, for some, be uncomfortable. They have been an uncomfortable reality for us for the better part of the year—however—an honest presentation of “the facts” should be the basis of our relationship. And the mutual interpretation of these facts should be the foundation of expectations going forward.
Equities
We lamented the narrow scope of the market’s rally earlier in the year in both our April and July Outlooks. We’re done complaining; however, we understand the frustration felt by many who may have missed our earlier points. Three-quarters of the way through 2023, let us assess where things stand to date.
By September 1, the S&P 500, often seen as a proxy for “the market”, was up nearly 18% for the year.
- By the end of September, the S&P year-to-date return was 11.68%.
- The seven largest companies in the S&P 500 accounted for 65% of the return of this index.1
- From the beginning of September to the end of September, simple arithmetic tells us the return of the “S&P 493”—the S&P 500 minus the largest seven companies, was between 6.3% (at the highest) and 4.08% (year-to-date through September). But this is on a market cap-weighted
- Five of the seven companies we omit from this math all reside in the same sector and have been driven up by proximity to the same narrative, defined as “AI”, or Artificial Intelligence.
- The last time the market was this concentrated was in the late 1800’s, surpassing even the narrow breadth of the Dot-Com era.
Taking a deeper dive, as of September 27th:
- The average stock in the S&P 500 index is up 1.4% year-to-date.2
- The median stock return of the S&P 500 index year-to-date is down 0.4%.2
- Currently there are 499 stocks in the S&P 500. 51% of these stocks are in negative territory year to date (254 issues), while 49% are in positive territory (247 issues).2
Of course, the S&P 500 is not the entirety of the US capital markets from which diversified portfolios generally draw their exposures. Through September 29th:
- The Russell 2000 (the universe of small-cap companies) is up 1.35% year-to-date, up 2.54% when we include the dividend.
- The Russell Mid-Cap index is up 9% year to date (TR).
- The equal weighted S&P 500 index is up 3.96% (an alternative to the S&P’s market-cap weighting scheme) year to date.
- The S&P 600 Information Technology index (market-cap weighted) is up 9.50% year-to-date, while the S&P 600 Equal Weight Information Technology Index is up 1.84% year-to-date.
- The NYSE Composite Index, which includes all stocks which trade on the NY Stock Exchange is up 1.41% year to date, and up 3.34% when we include the dividend.
- The Bloomberg US Aggregate Bond index is down 1.21%, while the Bloomberg Aggregate Municipal Bond index is down 1.38% year-to-date.
We hope these figures sink in for investors who have charged us with maintaining diversification in their long-term investment portfolios, especially given last year’s dismal returns across broad asset classes. Expectations for a “rebound” from 2022 have gone unmet in the markets, save for 1%-2% or so of the S&P 500—whose cap-weighted scheme gives us the illusion that “the market” is up double-digits year to date.

So, when investors, the media and others refer to what “the market” is doing or has done so far this year, followed by a return figure for the S&P 500, keep in mind that they are largely referring to 1.4% of the S&P 500. 98.6% of the market has a substantially different return profile.
The S&P 500 index was down 4.77% for the month of September, and through the month-end was down 6.28% from its July 31 high. The Nasdaq 100 (a reasonable proxy for the largest growth stocks in the market) was down 5.22% in September, and down 7.12% from its July 18th high. The good news is that September is over. The period from July through August is a seasonally weak anomaly, meaning that on average stocks often struggle during this time, often backsliding. Sometimes this weakness can bleed into October. By anomaly, we refer to seasonal trends which happen more often than not—but which do not happen 100% of the time. Getting through September is often a chore for investors. In contrast, the fourth quarter is a seasonally strong period for the market. Not always, but more often than not, and that’s the good news about September being over.

In July we said, “The second half of 2023 is likely to be less celebratory than the first half has been”. Not long after that was sent to our clients, markets began to retreat, and the “sawtooth pattern” reemerged. But is seasonality solely to blame for this retreat?
We are only halfway through the second half of the year, but there are other patterns that have emerged that we think justifiably have some investors nervous. Belaboring the point, we have made all year; interest rates are everything here.
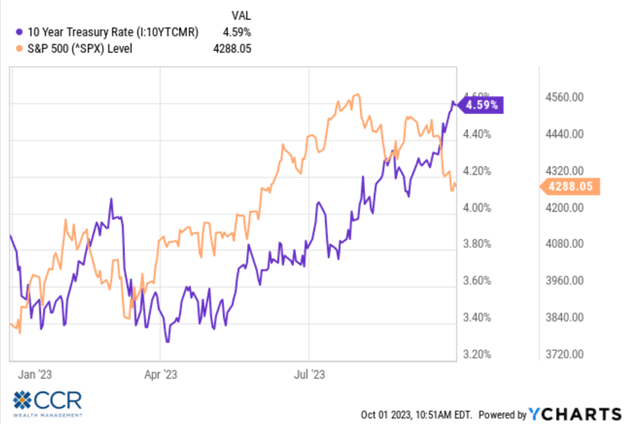
On August 1, the US Ten-year Treasury rate broke 4%--and has since not only stayed there but has advanced to over 4.50%. While July through September may be seasonally weak, we note that July’s returns were actually strong. The slide in the market over the last quarter may coincide with seasonality, but it also coincides with the climb in the 10-year yield above 4% around the beginning of August. As the nearby chart indicates, there doesn’t seem to be much standing in the way of this important indicator’s ascent.
Can stocks still advance while interest rates are rising? Technically, yes. In fact, equities rose all year while the 10-year yield rose from as low as 3.36% earlier in the year. Let’s not forget that “equities” this year have climbed, but at a much lower rate than the “Magnificent Seven”. It gets tricky though: yields rising from historically very low levels is one thing (normalization). But high yields climbing even higher, and the 10-year yield is at a 15 year high now, is an indication that the cost of everything is going up in the future, including the cost of capital for US companies. Since March of 2022 the Fed has been hammering away at rates on the shortest end of the yield curve. Investors are the primary influence on the longer end, including the 10-year yield.
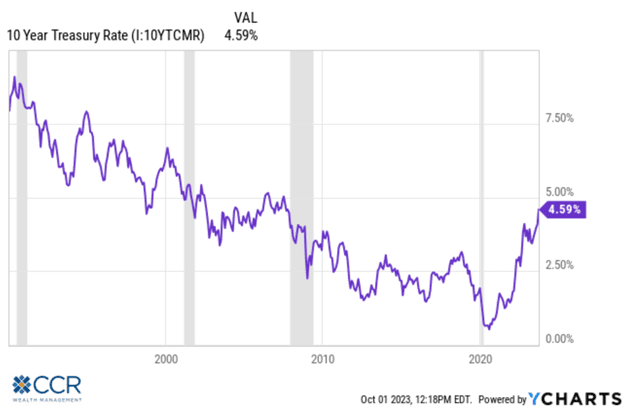
The 10-year Treasury yield is important. One reason is that mortgage rates are highly correlated to this index. The housing market, including the manufacturing and employment associated with it, is a major economic factor in this country. So is housing affordability as it directly impacts consumers’ discretionary spending. Another major reason is that when the yield is rising it means investors are not interested in owning the bonds. Selling the bonds causes the yield to increase more. Thus far, (since August 1) stocks have not been the beneficiaries of these bond proceeds. So where is the money going? Most of our clients have availed themselves of 5%+ money market rates this year to at least some extent. We think in the long term the yield on the 10-year must compete with the yield available at the short end, which comes with much less risk. The effective fed funds rate is currently 5.33%. We discuss other probable destinations for these proceeds later on.
The market distortions caused by monetary policy since the Great Financial Crisis are at least as enigmatic as the distortions caused by both monetary and fiscal policy since the Covid shutdowns. Zero-percent Fed funds and “quantitative easing” introduced by the central bank beginning in 2009 had the intended effect of pushing investors out on the risk spectrum—thus shoring up riskier assets which make up the foundation of much of our economy. Another term for this is “asset inflation”. Now that asset inflation has leaked into the broader domain of prices (wages, groceries, gasoline, etc.) and the Fed has engaged this inflation battle, could the opposite of asset inflation happen? Last year we pointed out that stocks now had competition from higher yielding bonds across the corporate, mortgage and government spectrum. Now, these bonds, as well as stocks, have competition from cash. Risk-free government-backed money markets have a better year-to-date return profile than the average of the vast majority of US stocks returns (the “Seven” notwithstanding) and bonds.
Economy
We go into the fourth quarter hopeful (because of seasonality), but with eyes wide open. A rebound in the last three months of the year is common, but not guaranteed (see 2018). In addition to being fed the narrative that “the market” is up double digits this year, most have also become familiar with the “soft landing” narrative. It sometimes seems to us that the “soft landing” story is a platitude to justify the S&P 500 index return and obfuscate the underlying 1.4% average S&P 500 stock return. A “soft landing” refers to a Fed rate-hiking cycle which slows down the economy, but which does not end in recession (and job losses). A “hard landing”, of course, is a recession caused primarily by the Fed’s restrictive monetary tightening which raises the cost of capital, results in economic contraction and wide-spread job loss.
We may be a bit jaded, but most agree that in the last 60 years, the Fed has engineered exactly one “soft landing”—back in 1995—making Alan Greenspan a celebrity Fed Chairman. There have been eight hard landings during this period (and we are not counting the latest Covid-induced recession, though the Fed was hiking before it). We have 550 basis points of rate hikes behind us, a 10-year yield at 15-year highs, but an economy seemingly immune to the immutable forces of interest rates. Other than a few mid-sized bank failures six months ago—all is hunky dory, yes? Color us skeptical--still. The “soft landing” scenario holds that the Fed is done hiking interest rates, the economy is in good shape, and will continue to grow—even accelerate as the fed looks to cut rates in 2024. All this may in fact happen. But in this environment, small cap stocks should be rocketing higher! As depicted above, the Russell 2000 Index is up only 2.54% year to date, and down 5.13% in the last quarter. There are reasons to be skeptical of the “soft landing” narrative.
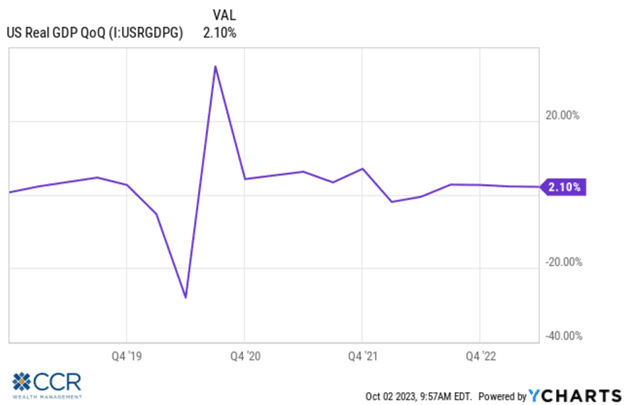
US Real GDP (GDP backing out inflation) quarter over quarter, is depicted nearby, and has slid somewhat from about 2.6% in Q4, 2022 to 2.1% through June. “Soft landing” adherents have their data, but so do their skeptics. A quick and non-comprehensive survey of both cases:
Soft Landing:
- Building permits are rising (a leading economic indicator), indicating an increase in home-building activity in the future.
- US Capital Expenditures are rising (slightly), indicating expectations of continued/growing business activity.
- Inflation, including the Fed’s preferred PCE indicator, has continued to fall this year.
- Consumers continued to spend…even in a higher inflation environment (Americans spent 5.8% more in August than a year earlier).
- The Fed is likely done raising interest rates.
- US labor markets have been significantly tight and remain healthy.
Maybe not so Soft:
- US Bankruptcy filings have increased 15% year over year through July.
- $1.8 trillion US corporate debt coming due in the next two years, rolling into significantly higher interest rates.
- Consumer spending accounts for roughly 2/3 of GDP. Consumer balance sheets are deteriorating from the pandemic surge, with sharply falling excess savings, falling savings rates, and increase in revolving debt.
- Credit card debt topped $1 trillion for the first time this summer.
- The expiration of the student loan relief expected to take as much as $100 billion out of discretionary spending.
- 30-year mortgage rates are at a 23-year high.
Labor market hiring has slowed over the last two months.
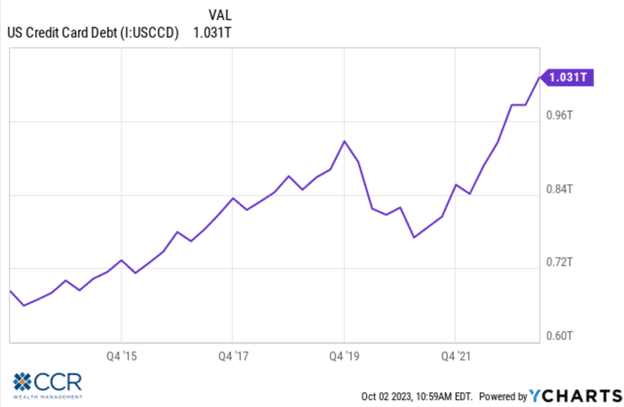
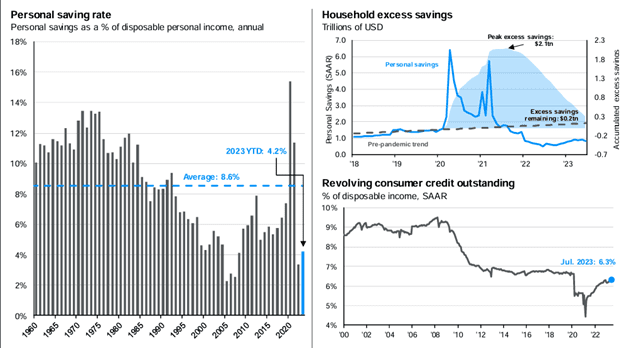
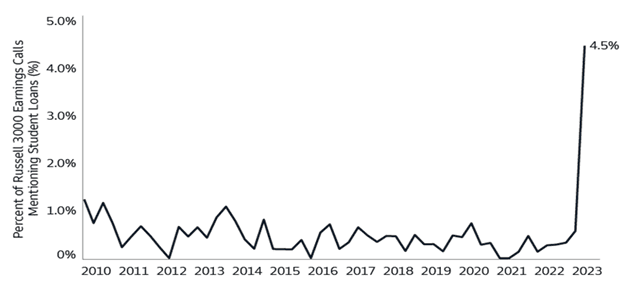
We focus on the consumer because of the important contribution consumption makes to US and developed economies GDP. Distortions from both Fed and fiscal pandemic policies have made it extremely difficult to ascertain economic health from just consumer spending alone though. While the “excess savings” not only provided buying power during the pandemic shutdown, it also provided an element of cushion in the post-pandemic inflation surge. We know this excess is dwindling, the question is when, and to what extent it disappears. Rising credit card debt may provide a clue. In short, if you believe consumers will continue to spend like “drunken sailors”, you should be all-in bullish on the economy!
Interest Rates
We spent some time above discussing interest rates in the context of both the economy and the equity markets. As everyone knows, on the short end of the yield curve the Fed has raised rates 11 times in the last 18 months, increasing the Fed Funds rate 5.50%. While they have been signaling this for the entire year, Chairman Jerme Powell in September stressed the “higher for longer” mantra, hinting that not only is another rate-hike before year-end a possibility, but that rate-cuts in 2024 are not a sure thing.
We have our doubts on both counts, but the market (minus the “Seven”) seems to have finally accepted the reality of elevated rates for years to come. We believe the Fed will “bend over backward” to make the last rate hike this summer the last of the cycle. Rather, we expect the Fed will prefer to “jawbone” expectations, as we believe they did in September.
The newest concern, however, is the rise of longer-term yields like the 10-year Treasury and the 30-year mortgage rate. As mentioned, mortgage rates, whether 15, 20 or 30 years are closely correlated to the 10-year Treasury yield’s movements. Additionally, longer term Treasury yields are a signal sent by the market of future economic and market expectations. As Treasuries are considered “risk-free” if held to maturity, the signal is basically a notion of what future inflation and economic growth will hold. Rising longer term rates suggest an increase in inflation is expected and provides a “hurdle rate” needed to be overcome by riskier assets (plus a term premium) to compensate for the risks taken in owning them.
So, what has influenced the 10-year Treasuries’ rapid rise since the summer? There are four theories floated.
- The surprising resilience of US economic data (“soft landing” fuel) this year suggests expected rate cuts in the future get pushed out further— “higher for longer”.
- Credit rating company Fitch lowered the US credit rating from AAA to AA+ in early August. This is the second rating cut after Standard & Poor’s stripped the US of their AAA rating back in 2011. Lower credit scores among nations, corporations and individuals demand higher interest debt service. We put the smallest weighting on this explanation.
- An announcement by the US Treasury that they will need to issue an additional $350 billion this year and $750 billion next year of additional debt (supply and demand—this has the effect of increasing supply, thus lowering demand. Rates must rise to attain equilibrium).
- Lastly, exogenous factors specifically associated with two of our largest creditors have had an influence. Japan is the largest creditor to the US, closely followed by China. In July, the Bank of Japan suggested allowing a widening of their 10-year yield target rate, which was followed by a hint from the Ministry of Finance that the BOJ may be preparing to raise interest rates. Jawboning rates higher is largely an effort to stem the deterioration of the Yen relative to the Dollar—the strengthening Dollar being driven by higher short-term US rates. This jawboning has also repatriated currency into the Yen and out of US Treasuries of all maturities.
The last point is particularly interesting to us as it is a collateral effect of the Fed’s policy. While not unexpected, it is also not the Fed’s intention, and is largely out of their control. Currency defense could also be seen as necessary in other economies eventually, contributing to the rise of US yields at the long end.
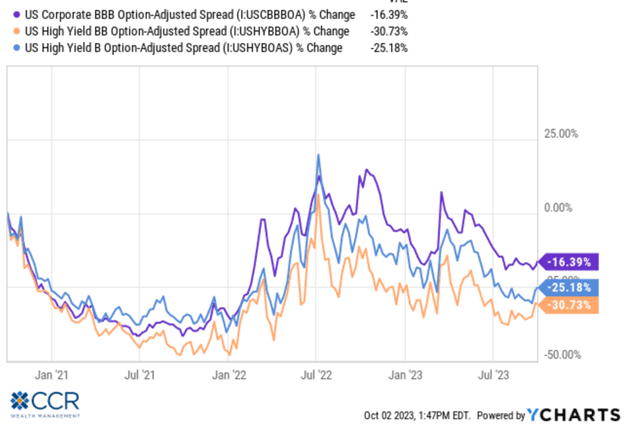
There are many market participants who expect a “credit event” to be the first sign of trouble in the equity markets (in case you’re not in the soft-landing camp). A common indicator monitored is the yield spreads between corporate bonds and treasuries (called “credit spreads”). The true “canary in the coal mine” is seen as the credit spreads within the high-yield market (companies most vulnerable to higher interest rates, and economic slowdowns).
But “credit event” is a broad category, and in truth, it could come from any direction--if it comes. China is the second largest economy in the world, is experiencing a significant economic slowing, is very indebted, and is struggling with a significant property bubble problem. Despite all the trade and geopolitical tensions between China and the West, particularly the US, China remains an important cog in the global economy. Ripple effects would be inevitable in the event of a crisis.
As mentioned earlier, $1.8 trillion in corporate bond debt matures in the next two years. Goldman Sachs estimates that debt maturing/rolling over next year would incur a 2% premium over expiring rates, and debt maturing in 2025 could incur rollover rates as much as 5.3% higher. At the least, this could be a threat to the continuing strength of the employment picture.
The potential sources of a “credit event” are numerous beyond these examples. And like the credit events of 2008, tend to be interconnected. But we hasten to add here that, like GDP and consumer spending, credit spreads in both the high-grade and high-yield markets have remained stubbornly defiant in the face of predictions of their demise. A slight tick-up in spreads over the last two weeks is worth monitoring, but as you can see, spreads from B to BBB rated debt remain well off the recent highs tied to the banking woes of March.
Final Thoughts:
CCR Wealth Management has expressed a more cautious outlook on the economy throughout 2023. Our opinion is informed by decades of observation of the relationships between capital markets and interest rates-whether Fed driven (on the short end) or investor-driven (down the yield curve). Market opinions have been sharply divided most of the year, with plenty of watchers in concert with our views, and others more confident in a soft-landing scenario. Thus far in the year the economy has been resilient amid a rate hike cycle not seen in speed or scope since the early 1980’s. As we have outlined, we attribute this more to the difficulty of deciphering recent monetary and fiscal policy distortions in the economy—particularly as it is related to consumers, than a newfound resistance to interest rate influences. Artificial intelligence advancements will have profound impacts across broad swaths of our economy and markets, eventually—and “eventually” doesn’t rule-out soon! As we indicated in our last Outlook, as with the internet twenty-five years or so ago, adoption of AI tools will be mandatory for businesses to remain ongoing concerns, not optional. By “soon” we believe the significant productivity gains for most companies are at least 2-3 years away, not months or quarters away. We have also outlined the stark difference between market cap-weighted broad indices which are influenced by an extreme minority of constituents, and the actual returns experienced by the vast majority of publicly trades stocks. Conflating “AI” with the S&P 500’s returns this year or conflating the S&P 500’s returns this year with the broader market is a mistake, in our view. The latter is especially disproven by the facts we laid out early on in this Outlook. In fact, markets continue to adjust to a decidedly different regime than the one we were in for the thirteen years post the Great Financial Crisis. Bond yields are very attractive, and we do hold with the consensus that rate cuts are more likely than not next year, which should help all asset classes (not so much cash though). While our Strategic Models began the year more defensively positioned, our adjustments to a more neutral footing in the Spring acknowledges market realities without ignoring the possibilities of gathering headwinds with significantly higher interest rates.
As wealth managers, we are mandated to maintain diversification—especially in the face of uncertainty, rather than play musical chairs with clients’ portfolios based on popular, yet fickle market opinion. As always, please don’t hesitate to contact your CCR Wealth Management advisor to discuss issues regarding market expectations and your portfolio, or to further refine your preferred allocation details.
- Source: Morningstar, FactSet, 7/31/2023
- Source: Bespoke Investment Group, 9/26/2023
The views are those of CCR Wealth Management LLC and should not be construed as specific investment advice. Investments in securities do not offer a fixed rate of return. Principal, yield and/or share price will fluctuate with changes in market conditions and, when sold or redeemed, you may receive more or less than originally invested. All information is believed to be from reliable sources; however, we make no representation as to its completeness or accuracy. Investors cannot directly invest in indices. Past performance does not guarantee future results. Additional risks are associated with international investing, such as currency fluctuations, political and economic stability, and differences in accounting standards.
Follow us on social media for more timely content delivered directly to your news feed!
