January 2025 Market Outlook
Executive Summary
Historically, annual stock forecasts average a 5% to 10% gain, yet actual market outcomes often defy these predictions. Concerns surrounding potential market corrections after two consecutive years of 20%+ gains are often unfounded, as similar patterns have produced mixed results in the past.
Looking ahead to 2025, the new administration may introduce important policy changes, such as tariffs and deregulation. While tariffs are generally viewed negatively by economists, past implementations did not prevent significant gains in the S&P 500. Deregulation in energy production also poses risks, as previous initiatives led to underperformance in that sector. With a narrow House majority, policy execution may face hurdles, suggesting that investors should remain cautious and adaptable to ongoing market volatility and political shifts.
We have two classes of forecasters: Those who don’t know—and those who don’t know they don’t know. –John Kenneth Galbraith
We wish all our clients a happy, prosperous and healthy New Year!
As happens annually, this is a time for market and economic prognostications for the year ahead—an exercise we do not participate in at CCR Wealth Management. We read recently in the New York Times an article by Jeff Sommer, headlined “Wall St. Is at It Again, Making Irrelevant Market Predictions”. No judgements of this annual tradition seem truer to us. Generally, when you average all prognostications every year, you come up with an average forecasted expectation between a 5% gain and a 10% gain for the coming year in stocks—every year. Last year was no exception. Down years are virtually never predicted. In truth, there is absolutely no correlation between what the markets do in a year, and the predictions at the outset of that year.
We have also read several ominously worded concerns in the media that point out the end of 2024 saw the S&P 500 completing two back-to-back 20%+ years. The portentous implication being we must be due for correction. But this too has no basis in statistical relevance. As Bespoke Investment Group has pointed out, this set-up (market +20% or more in back-to-back years) has precedence three times. In 1937, stocks fell 39% after the previous two-year bull run. In 1956 stocks were essentially flat (+3%) following a two-year bull run, and in 1997, stock rose 31% after gaining 37 ½% and 23% respectively in the previous two years. In our view, investors should always be prepared for a pullback. Two steps up—one step back is the long-term trend of the market.
Of course, 2025 does usher in change in the form of a new administration and balance of political power in Washington. While “new” may not be the most correct descriptor, it at least conveys that investors should expect policy change. Here too, though, expectations are both informed by precedent but clouded by a long list of failed predictions from the previous Trump presidency. “Tariffs” seems to be the ubiquitous expectation, along with their accompanying side effects. Deregulation and tax cuts are hot on tariffs’ heels.
Much has been the handwringing over tariffs, both in the first Trump term and today. Economists generally look at tariffs as an unnecessary burden that transitions trade deficits into higher prices for Americans, ultimately harming the US economy. We cannot say we disagree in principle. But from an investment perspective we think its worthy to note that from Trump’s first enactment of tariffs in March of 2018 (25% on steel and 10% on aluminum imports), along with subsequent tariffs on China, and certain Canadian and European goods, the S&P 500 rose 49% to the end of his term in January 2021. This return includes a brutal 6-month period lost to the Coronavirus lockdowns. It is true that in that year (2018) stocks ultimately lost about 4 ½%—but most research would chalk this up to missteps by the Fed in October, and concerns about a coming Chinese economic slowdown. Consumer prices actually dropped (yoy) from the first enactment of tariffs to the start of the pandemic shutdowns.

The world is a different place in 2025. We cannot and do not say tariffs won’t become inflationary. But we think it is also true that advisors in Trump’s orbit recognize one of the primary reasons their campaign won the economic argument in November and would be loath to cause much in the way of further price increases on consumers (and voters). In short—radical “positioning” in front of expected tariff announcements is likely to lead to unexpected outcomes and we discourage it.
Deregulation is a broad topic, but we think it is fair to say many minds turn to domestic energy production—at least in terms of policy contrasts, when they think of it. “Drill Baby Drill” 2.0 is what many are focused on today. Before you go rushing into energy stocks, keep in mind that the “America First Energy Plan” (or “Drill Baby Drill” 1.0) unveiled soon after Trump’s first inauguration heavily focused on fossil fuel deregulation and rolled back over 112 environmental rules, according to the New York Times. The result? The S&P Energy Select Index lost a cumulative ~39% over the span of the first Trump administration, easily the worst performing sector in the S&P 500. Cause and effect are not so transparent in the markets, and narrative is, well, just that (more on this later).

Republicans have a recent history of being a fractious lot. We are not diving into political punditry here, but we do have the sense that more attention is being paid to policy than personality this time around. An exceptionally narrow majority in the House suggests to us that not all policy goals will receive smooth sailing, and again, “bets” in an investment portfolio likely come with lower probabilities of success than many anticipate, at least when it comes to market-based policy outcomes.
As measured by the S&P 500, stocks rose 24.23% in 2024—a good year by any measure. Interestingly, though, the fourth quarter saw only a 2.82% gain (of course this occurred after we pointed out in October that Q4 is historically the time for the best market returns!). Worse, the month of December, usually the strongest month of the year historically, saw the S&P drop 2.73% in an overwhelmingly negative tone. Breadth (the percentage of stocks trading above their 50-day moving averages) was the lowest since 2023. In fact, the vast majority of market gains were already “in the bag” by mid-July (+19%), and the market only slogged marginally higher in the final months. Some observers have pointed to inflated stock valuations as the culprit (plausible), and others to politics (irrelevant). For ourselves, we focus on the interest rate picture, and we return to Jay Powell’s convoluted justification for a 50-basis point rate cut back in September (which has been followed with another 50 basis points since).
To review, this was a Chairman Powell quote from the September address after the Fed cut 50 basis points: “I don’t see anything in the economy right now that suggests that the likelihood of a recession, sorry, of a downturn, is elevated. I don’t see that. You see growth at a solid rate. You see inflation coming down. You see a labor market that’s still at very solid levels.” Yet whether measured by the unemployment rate, wage growth data, the JOLTs data, CPI or PCE—it is difficult to share in the Fed’s confidence that such a statement implies. AND there have been two additional rate cuts since then. The data suggest—at least through mid-December--that labor demand is softening, wage growth is softening, and inflation is getting more stubborn (not a great combination).
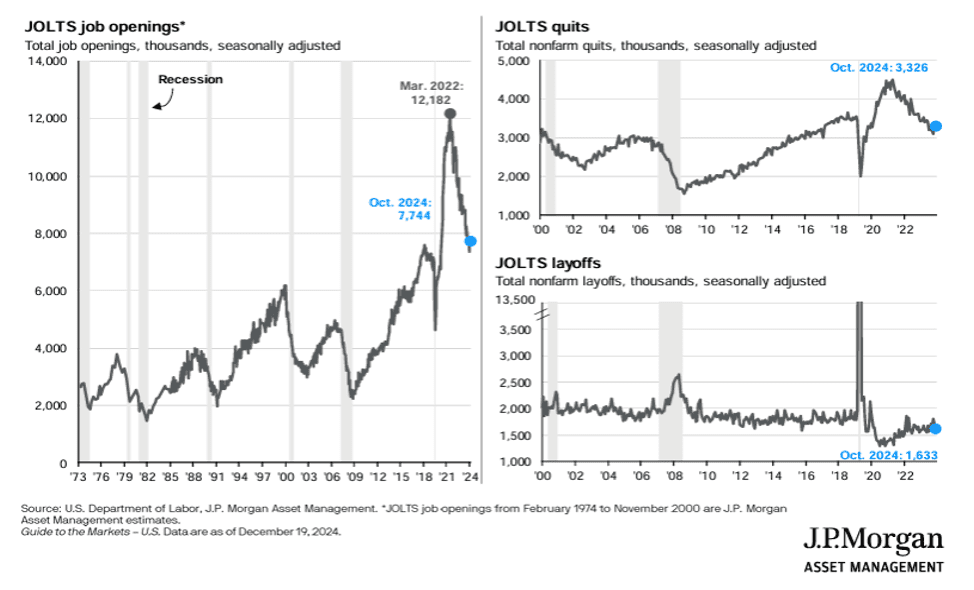
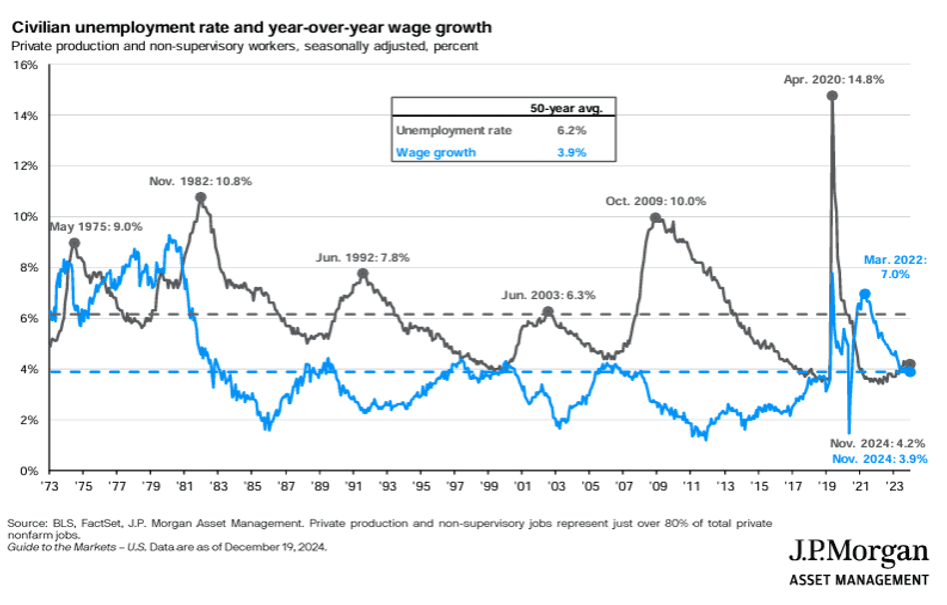
To be clear—nothing is “falling apart”. But the lack of continued progress of late has the market concerned. Also—contrast the confidence of September’s Fed statement with the caution of December’s statement:
“We understand very well that prices went up by a great deal, and people feel that, and it’s prices of food and transportation and heating your home and things like that. So there’s tremendous pain in that burst of inflation that was very global…Now we have inflation itself way down—but people are still feeling high prices—and that is really what people are feeling.”
After acknowledging that “We have been moving sideways on 12-month inflation”, Powell & company essentially threw some cold water on the number of rate-cuts expected in 2025. It is this, not politics, and not valuations (alone) we attribute Q4’s lack-luster equity performance.
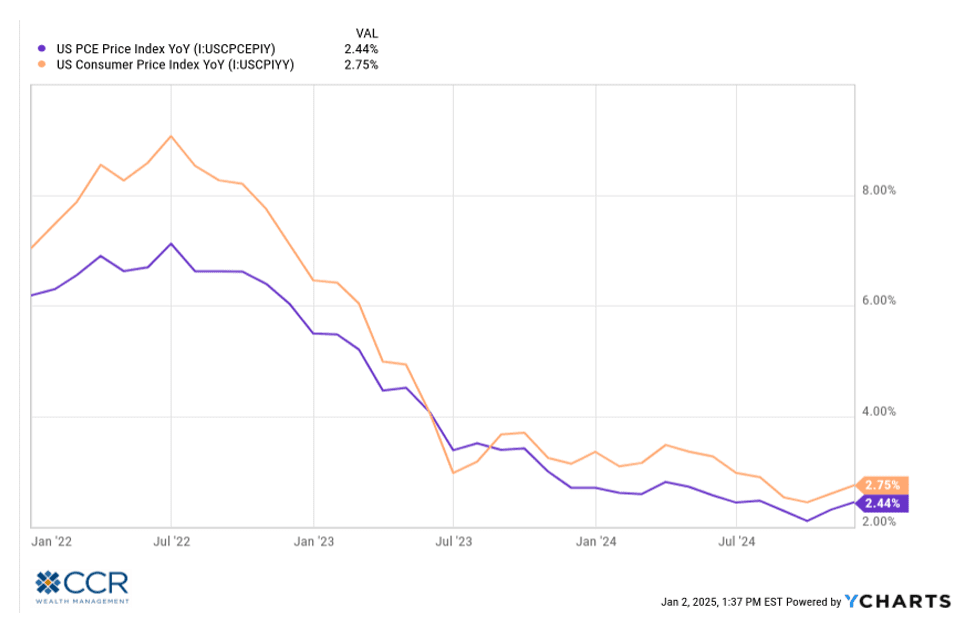
It is of course easy to arm-chair quarterback. As we have pointed out before, it is difficult to attribute all the price increases of the last few years to the Fed (our view is that fiscal policy is at least half-culpable). While the Fed is not blameless, they are expected to manage the entire problem, an unenviable task. A decline in the rate of price increases (inflation) is not a decline in prices themselves. For that to occur—it usually takes a recession—and a deep one at that. If you read this newsletter regularly, you will know that we have been skeptical of the rate-cut cheerleaders on Wall Street for years. Wall Street has grown addicted to the sugar-high of exceedingly lower interest rates for well over a decade now. But as we have seen last year, inflation has been “sticky”, with the PCE Price Index (the Fed’s preferred measuring stick) at 2.44%, well ahead of the 2% target, and seemingly moving in the wrong direction since August. In fact, as depicted in the nearby chart, it seems the rapid pace of deflation began to wane back in July of 2023. As they say, the last mile is the hardest.
Again, with most equity gains last year occurring by July, it is important to note that calendar years are constructs of human organization and are really abstractions when it comes to market returns. The Federal Reserve works on a continuum, as do the capital markets (and as do financial plans, we should add). Where you place “year beginning/ending” markers can make a huge difference in 12-month returns. Perhaps the only relevance to the calendar when it comes to investing has to do with the IRS.
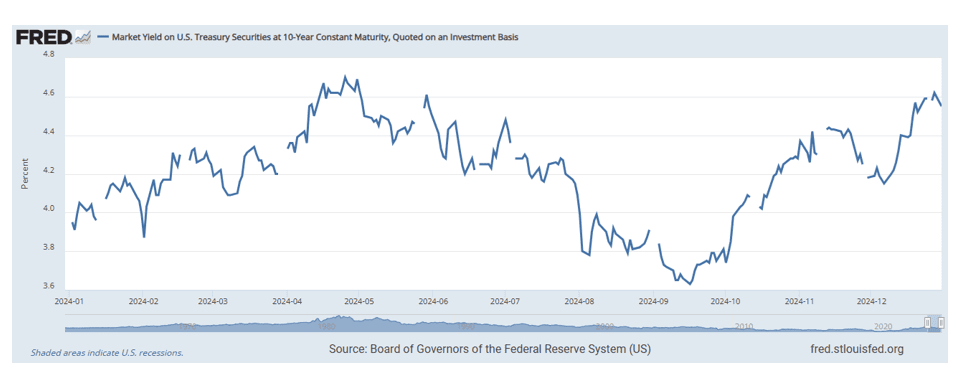
The “slog” in equities the last 3-4 months seems to match up with the rise in longer term bond yields, which bottomed this year in September, and ironically took off again after the Fed cut its short-term interest rates. This has had many scratching their heads: interest rates get cut by the Fed (reducing cash yields from T-Bills and CDs to money markets)—but the longer end of the yield curve rises (notably along with mortgage rates which are highly correlated with the 10-year Treasury yield). What gives? In our view, the short answer is that the market has recalibrated their expectation of future inflation (it’s sticking around, maybe at current levels), and therefore, the likelihood that the “neutral rate” the Fed seeks to target (a murky concept) is higher than the Fed’s oft-stated goal of 2%. Equities (and just about everything else) have adjusted accordingly. With this explanation—if you buy it—an inflection point may have been reached well before the end of the calendar year was.
We have also read quite a bit about yields as they pertain to bond returns lately. No doubt—there exists an inverse relationship between the price of a particular bond and the spot yield at that point along the yield curve (the maturity date). But it should also be placed in context of time. A hypothetical government-backed yield of, say, 5% maturing in 5 years lost some value over the last few months as longer-term interest rates rose—perhaps as much as 1%-1.5%. Compared to a cash instrument—like a money market—that may seem like a bad deal (money market values are stable at $1 NAV) if the money market also paid out a 5% yield last year. But—you will be getting 5% for five years from the bond, whereas your money market rate likely now has a current yield of 4.40%possibly dropping further as the year progresses.
When bonds are written about in the financial media they are, like stocks, usually referred to with a proxy (stock proxy is often the S&P 500 or some similar broad-based index). The most common bond proxy remains the Barclays Aggregate Bond index. The two indices are similar in one respect, they weigh the largest components (issuers) the most in their valuation formulas, but this has an opposite effect. Market-cap weighted equity indices emphasize the largest companies whose size is generally indicative of their equity value. A stock goes up, the company gets bigger—a good thing. Bond indices like the Barc. Agg. also emphasize the largest components, but the listing is debt, not equity. In other words—the index is an “adverse selection index” made up of the most indebted components of US government, agency and corporate borrowers. This is why CCR Wealth Management stresses active management components for bond portfolios. Navigating this opaque market along the yield curve is essential. And unlike the S&P 500, an adverse selection index is usually quite readily bested, even by mediocre managers.
We are happy to report that CCR bond portfolios acquitted themselves well in what turned out at the end of the year to be a challenging environment as longer-term yields rose, handily beating the index as well as cash yields. But as we must say, past performance is not a guarantee of future returns.
If there is an upside to the recent spike in longer term yields, it is that the “yield curve” which we have discussed several times over the last two years, is no longer inverted. This normalization process which returns us to a world where investors are compensated with higher yields the further out they invest on the yield curve has been a bumpy business—and may remain so for a while. It predictably resolved with both shorter-term interest rates declining, and longer rates rising.
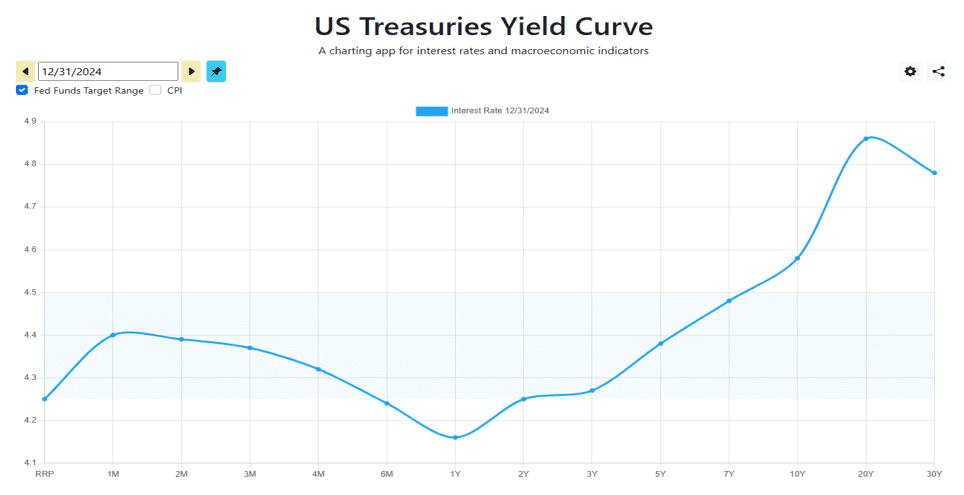
We continue to view bonds as preferrable to cash instruments despite the messy normalization process. Bond yields are higher and cash rates are declining.
Since the GFC (Great Financial Crisis) of 2008-2009, we have often described the United States as the cleanest shirt in a pile of dirty laundry. This continues to ring true. The recent changes ushered in by our electorate are but a reflection of political tumult around the world. We have seen the collapse of governing coalitions in Germany and in France, Europe’s two largest economies, largely due to economic reasons. Canada is next. The UK is a mess, and South Korea recently impeached their president and remains in a state of political limbo. We can at least say that our transition has been more orderly. What ails the world ails the US, but less so. Inflation and debt are underlying universal hangovers from pandemic policies and dubious climate mandates. CCR Wealth Management has, in recent months, reduced our non-US equity (in our Strategic models) allocations from a historic high to moderately below benchmark levels.
Before wrapping up, we want to revisit the theme of “expectations” which we opened this Outlook with. Long-time clients and readers of this newsletter know that a recurring theme of our Outlook is looking skeptically at the narrative du jour. To dive a bit further into the definition of “narrative” we will quote at length Nassim Nicholas Taleb, a mathematical statistician, essayist and author, former option trader and risk analyst. His book “The Black Swan” has had significant influence on how we interpret the firehose of market information today, and we recommend it highly.
We like stories, we like to summarize, and we like to simplify, i.e., to reduce the dimension of matters. The first of the problems that we examine…is what I call narrative fallacy. (It is actually a fraud, but, to be more polite, I will call it a fallacy.) The fallacy is associated with our vulnerability to overinterpretation and our predilection to compact stories over raw truths. It severely distorts our mental representation of the world; it is particularly acute when it comes to the rare event.
Taleb goes on to discuss the actual randomness of events and the enormity of influences and occurrences that shape our reality. Of course, we concern ourselves with the investment universe, but even within this confine, the sheer number of influences on stocks, bonds, commodities and interest rates is staggering. But luckily, we have a media industry to not only help us sort it out, but to tell us how to think about things! I call this the “On The Heels Of” fallacy.
Tune into CNBC or some other financial news network every day shortly after 4:00pm, and you will be informed by a polished, confident-sounding, and likely attractive talking head that today the market was (up 1%, down ½%, flat…or whatever) “on the heels of” (fill in the blank: someone said something, interest rates rose/fell, some company released earnings, or something happened in the Middle East). That’s it. That’s all you need to know! Cause and effect summed up in a tidy soundbite for you to tuck away as factual knowledge.
Taleb continues:
We harbor a crippling dislike for the abstract.
One day in December 2003, when Saddam Hussein was captured, Bloomberg News flashed the following headline at 13:01: US TREASURIES RISE; HUSSEIN CAPTURE MAY NOT CURB TERRORISM.
Whenever there is a market move, the news media feel obliged to give the “reason”. Half an hour later, they had to issue a new headline. As these US Treasury bonds fell in price (they fluctuate all day long, so there was nothing special about that), Bloomberg News had a new reason for the fall: Saddam’s capture (the same Saddam). At 13:31 they issued the next bulletin: US TREASURIES FALL; HUSSEIN CAPTURE BOOSTS ALLURE OF RISKY ASSETS.
Taleb also discusses the stark tendency for all media outlets to echo each other in packaging the explanations of daily occurrences for us. Something behavioral finance calls ad populum fallacy. Get enough people repeating something, and it becomes “true” simply because many other people believe it.
We used the example early on of the “Drill Baby Drill” slogan, originating roughly eight years ago. We know many—prodded by ad populum fallacy--who dove into oil and gas stocks then. Ouch. The list goes on. This Outlook has, more than once, cited the marijuana stock bubble some years ago as a complete narrative fallacy. In fact, the phenomenon of narrative fallacy can be traced all the way back to the South Sea Company bubble of 1720 and the Tulip Mania bubble nearly 100 years before that.
Behold, below, the collapse of the “clean energy” sector.
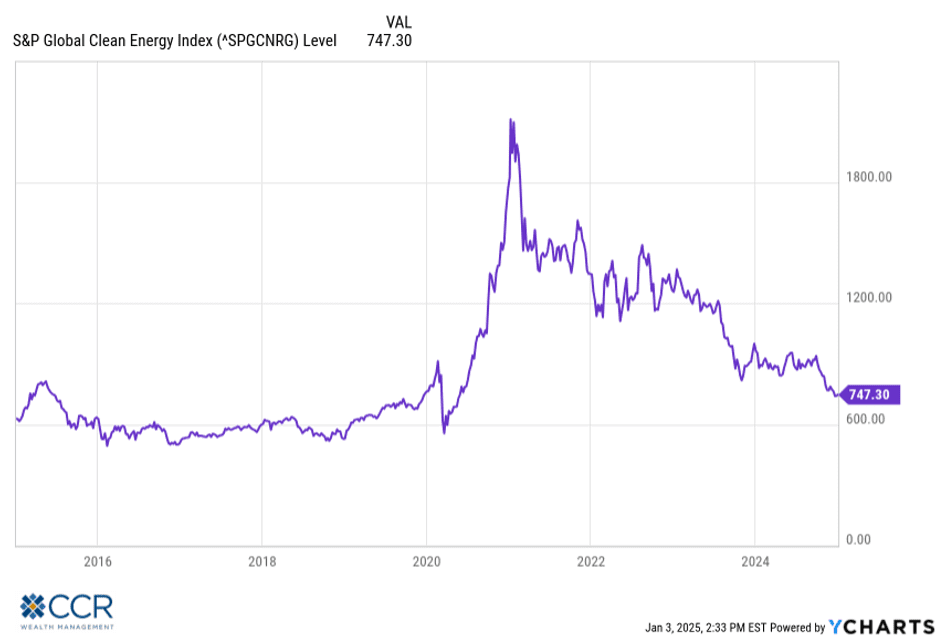
It doesn’t matter where you come down on the political issue of environmental policy—that’s an ugly chart. Yet it was cheer-led up by narrative (certainly not profit). Billions and billions of dollars were promised by the Federal Government to be invested in “infrastructure” projects to electrify and de-carbonize our economy. Repeated ad-nauseum in the media, many bought into this narrative. This chart covers a ten-year period, long term by any measure. Ouch.
The CHIPS and Science Act was signed into law in August of 2022 and pledged hundreds of billions of dollars, tax-payer money, to on-shore US production of semiconductor manufacturing, among other things. Oh—and there is of course the AI angle. This bill was made famous in the financial media by incessant coverage of all the positive effects it would have on the US semiconductor sector. If you read our October Outlook, perhaps you have a cursory understanding of technical analysis. The Philadelphia Semiconductor Index (SOX) just entered into a bear cross ( or “Dark Cross”: DC) on December 26th with the 50-day moving average falling below the 200-day moving average. The implication is that the longer-term trend is negative. How is this possible? Especially with a market-cap weighted index whose largest component is up 200% in the last twelve months? That doesn’t seem to comport with the narrative.
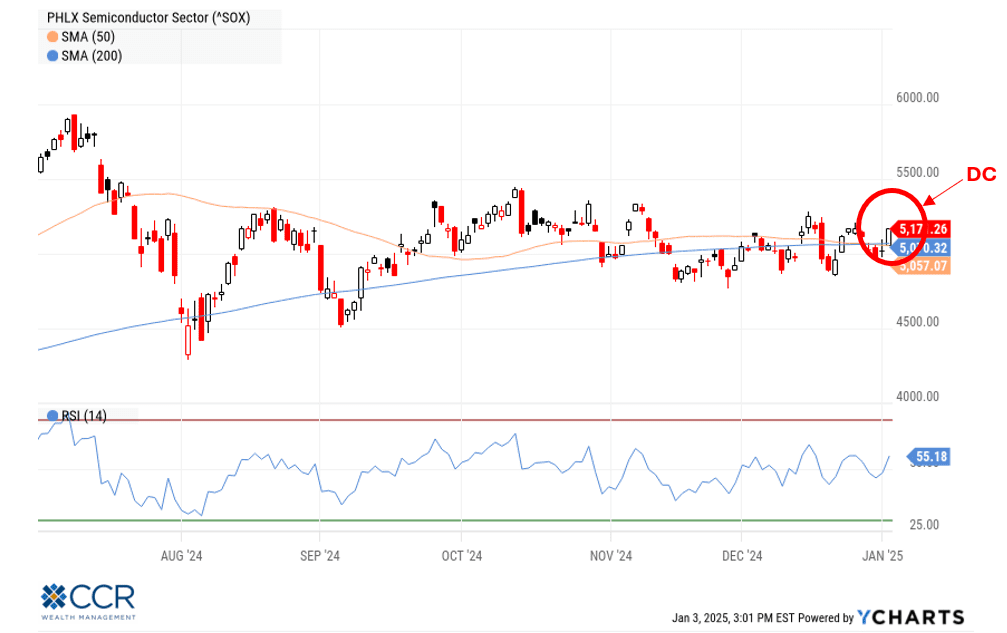
Our point is simply that examples abound throughout recent, long-term, and very long-term history that “narrative”—that curated information down-load you are subject to daily—and its correlation to real investment prospects (actual investment returns once the media attention diverts) is often illusory.
Where are we going with this?
Roughly seven years ago we sent out a general “primer” on cryptocurrency. We believe our tone was neutral in explaining what it was, and we think it also balanced in the examination then of proponents and detractors. We also think today the narrative is anything but balanced. “Crypto” is treated like any other stock market sector, requiring regular media updates on the price of Bitcoin or any other myriads of these “tokens”. About a year ago, the US Security and Exchange commission finally gave the greenlight for spot Bitcoin ETFs to trade on US exchanges, after a ten-year long review of the matter. The narrative took off…as did the price of Bitcoin.
As we have thought about the issue over the long term, we will say here that our outlook on Bitcoin and other cryptocurrencies is less balanced today than it was seven years ago, and skews negative. The heart of the matter to us is that we view the entire industry as a narrative fallacy. There is a perception that since large financial institutions are now providing access to Bitcoin through US markets with the blessing of the SEC that Bitcoin has now been legitimized, adopted and/or sanctified by these institutions. Indeed, this seems to be the tone of the daily media coverage (ad populum). We think nothing of the sort. Of course cryptocurrency is speculative, but we think this is an incomplete portrait at best.
This is the business they are in. “Experts” interviewed daily about their opinions on crypto are universally bullish—all the time. As owners of these tokens, it is in their interest to create interest.
But what is the actual value of the underlying? Seven years ago, we outlined the definition of a currency (a store of value, a medium of exchange, a unit of account). We see no more “adoption” today of Bitcoin as a legitimate use-asset than we saw then. As then, today’s primary “users” of Bitcoin and other cryptocurrencies are among the underbelly of the dark web, using it to fund the drug trade, human trafficking, money laundering, bribery, malware and other internet scams. According to the FBI’s 2023 Cryptocurrency Fraud Report, over $5.6 billion was lost to cryptocurrency fraud, up roughly 45% from 2022. This almost surely is understated given how much goes unreported. And it also excludes incidents like Sam Freidman’s $11 billion FTX fraud. Trading an asset like a stock, an ETF or cryptocurrency is not “adoption”.
Excitement has also been injected into the crypto-world by Donald Trump who has surrounded himself with crypto-executives and floated the idea of a crypto-reserve. But Donald Trump has said a lot of things, and legitimizing a competitor to the US dollar is likely not going to happen. “Stable coins” have a premise quite different from the free-floating Bitcoin (and its ilk) on which so many dream of becoming rich.
We venture to guess that most investors would consider Warren Buffet and Jamie Dimon worthwhile opinionators with regards to investing. Buffett has repeatedly said he sees no value in Bitcoin or any other cryptocurrency. “In terms of cryptocurrencies, generally, I can say with almost certainty that they will come to a bad ending” he opined on CNBC just two months ago. We were in the audience recently at JP Morgan when Dimon was asked again about his opinion of Bitcoin. “Fraud” was his one-word answer. These men have maintained their opinion as Bitcoin has reached stratospheric levels. It is up roughly 1,550% since we released our cryptocurrency primer back in 2017.
As we opened this Outlook with the notion that CCR is not in the prediction business, we reiterate it when discussing Cryptocurrency. Just because we see no reason to believe Bitcoin will go higher from here does not mean it won’t double. The “Greater Fool Theory” is at work when excitement is in the air about something no one really understands. People buying Bitcoin here apparently saw no value at $6,000. They are motivated by narrative, and under the (perhaps subliminal) assumption someone with even less knowledge will buy their Bitcoin at an even higher price. Bitcoin pays no dividends, earns no interest, and doesn’t have earnings. The same was true with Dutch Tulips and South Sea stock shares. Suffice it to say to our clients that just because the SEC has countenanced Bitcoin ETFs to trade on US exchanges, it is implausible that cryptocurrencies will ever be part of CCR Wealth Management model portfolios. We began and ended our cryptocurrency primer with caveat emptor seven years ago. We think this rings as true today.
Follow us on social media for more timely content delivered directly to your news feed!
