January 2024 Market Outlook
Well, we know where we’re going
But we don’t know where we’ve been
And we know what we’re knowing
But we can’t say what we’ve seen
— Talking Heads; “Road to Nowhere”
Welcome to 2024!
Recaps can be tiresome, and we have read plenty of 2023 market recaps in recent weeks. However, it is hard to know where you’re going if you don’t know where you’ve been…so the saying goes. Maya Angelou is most often quoted as the originator of this sentiment. It is a nod to the importance of historical understanding and the perspective one gains from it to appreciate the present—and perhaps even to enlighten us on the path into the future. David Byrne and the Talking Heads seemed to turn the phrase around in 1985 with the release of their “Road to Nowhere” hit. Over the years we have found history an important, if imperfect, guide in navigating market and business cycles. Our “Investment Philosophy” has stated so for well over a decade. In it, we acknowledge that history never actually repeats—but its cyclical rhythms do tend to rhyme. We find it more difficult these days, however, to get ourselves out of the “present” narrative. “Breaking news” has lost all urgency, as little of it is actually news. Certainly, investors have seemed content with much of the cheerleading of the market’s “Magnificent Seven”—and equally content to ignore the diminishing returns of the rest of the market. “We know what we’re knowing/But we can’t say what we’ve seen”. This has the potential to set investors up for some nasty surprises.
What then to make of not just last year, but of the last two? For us—the story is not simply about last year’s stock market rally—an inevitable reversion to the mean—at least for the index averages. It is about understanding the nature of the rally, as well as the nature of the preceding bear market—all this in an effort to add perspective on where the trend is, and perhaps where the pitfalls lie. In 2022, investors experienced a very broad and deep correction across all

asset classes as inflation ran rampant and the Federal Reserve got down to brass tacks with hawkish monetary policy. It was unpleasant to be sure, however, on some level, it made sense. Higher inflation has historically brought higher interest rates. Higher interest rates reduce the value of fixed income and have a disparate impact on the value of future cash flows of equities discounted to discover present-day prices. The higher the cash flow growth assumed in the future, the more negative the impact of higher rates. This is exactly what we observed—exactly what transpired, with the high-growth, tech-heavy NASDAQ faring much worse than the broader markets. Again, so far, this all made sense.
Turning the page to 2023, last year’s rally seemed like a normal reversion to the mean—at least as far as the broader market averages are concerned. But most of the year was marked by a handful of mega-cap companies rallying massively on the back of the artificial intelligence mania (yes, we finally have applied this word). The market-cap weighting schemes of the indices gave the impression that the market was rallying significantly, when in fact through most of the year, most stocks were treading water after the 2022 bear market. Most stocks were not reverting to the mean—only the index averages.
We spilled plenty of ink about this phenomenon last year, yet conversations we have had with investors suggest that in many cases (if not most), the belief remains that “the market” was rallying all year—better than 2% per month for 12 months, despite all evidence to the contrary. Cognitive dissonance, indeed. January, March and June of last year accounted for 115% of the index’s 13% total return through the third quarter, and yet as we pointed out in our last Outlook, the average S&P 500 stock return was about 1.40% throughout this period. “Knowing where we’re going” with all certainty without grasping “where we’ve been”.

More benign inflation data in early November seemed to turn this dynamic around—and none-too late, from our point of view. Evidence of still falling CPI brought the ten-year Treasury yield down sharply from its 5% peak, and small cap equities rallied to a degree that they actually exceeded the return of the S&P 500, as did the equal weight S&P 500. And both these indices significantly outperformed the Magnificent 7. Now—to a degree anyway, this made sense!
Whether we agree with the outlook or not the notion of a soft landing, a notion that has been ingrained in the narrative since at least mid-summer, should be producing a rally in small cap equities that, to “rhyme” with history, should far surpass that of the S&P 500. But this is a historical norm—and not the experience of 2023—save for the last two months of the year. To be sure—we still haven’t bought into the soft-landing scenario, at least not 100%. Citing Jeff Schultze of ClearBridge Investments, the Wall Street Journal pointed out last week that since the late 1950’s an average of 23 months have passed since the initial rate hike of a tightening cycle to the beginning of an economic downturn. We are on month 21. “Long and variable lags” was Milton Friedman’s description of the impact of monetary policy. 550 basis points of rake hikes in little more than a year has been the Fed’s prescription for conquering inflation since 2021, exceeded in history only by Paul Volker’s Fed in the early 1980’s. The gray bars in the nearby chart of the Fed funds rate are recessions. When does the next gray bar appear?
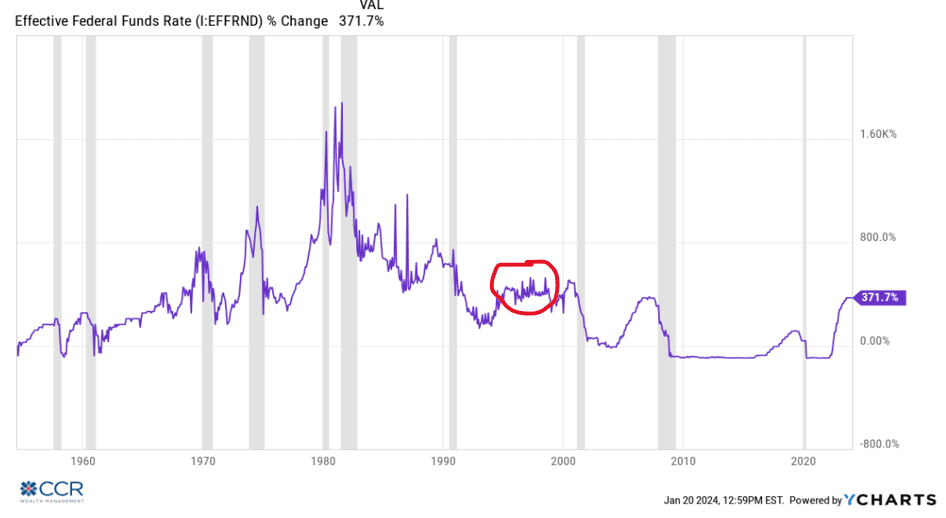
Note the highlighted period of 1995-1996: arguably the only soft landing in this entire post-war period.
A year after cautioning investors of a likely economic slowing—if not outright recession later in 2023, we are reminded of Vladimir and Estragon in Samuel Beckett’s “Waiting for Godot”. Convinced and expectant of an outcome that is…late, to say the least. Many of the data points supporting our thesis that a soft landing isn’t guaranteed remain, but also remain unrealized. They have to do with debt, and with interest rates. We’ve had plenty of company—also “Waiting for Godot”. Recall JP Morgan CEO Jaimie Dimon’s call to investors to “brace yourself” for an “economic hurricane” caused by the Fed and the war in Ukraine. That was over a year and a half ago. Most recently (January 9), Jeffrey Gundlach’s webcast to investors cautioned against expectations that the S&P 500 trend will continue, and predicted a 75% chance of recession this year, with widespread job losses. Mr. Gundlach oversees $140 billion in assets at his firm Doubleline Capital.
From an investment perspective, we are not positioned for a negative outcome (in our Strategic models), though we were a year ago. A balance must be struck between our convictions and present reality. We are reminded of the early days in our career at Morgan Stanley, where we paid heed to the now late Barton Biggs, a renown global investment strategist. Mr. Biggs famously spent the latter half of the 1990’s disparaging what he saw as unjustified rising equity valuations—particularly within the technology sector. A favorite device he used to illustrate his opinions was the specific investment advice he would receive from the likes of his taxi driver, his plumber, or others far removed from his own expertise and experience, opinions largely congealed from CNBC, Motley Fool, and other then- burgeoning investment news outlets.
In the end, Barton Biggs turned out to be spot-on correct. The carnage of the dot-com era lasted for a decade, at least. But in the years leading up to his vindication, the Greater Fool Theory prevailed, and made a fool of those who stood athwart the narrative of the day. We can only seek to caution our own client expectations. We can only seek to educate on the impact of market-weighted indices, and the differences between these indices and the actual markets. The importance of broader market participation, particularly among smaller companies, lies in the fact that small companies, including those in the Russell 2000, are the engines of job growth in this country. This is not true of, say, the S&P 500 constituents. Today, the Russell 2000 collection of small companies employs approximately 6.4 million Americans, whereas the Magnificent 7 employs approximately 2.2 million. Positive jobs data cited as a component of the soft-landing narrative emanates from this cadre of small companies.
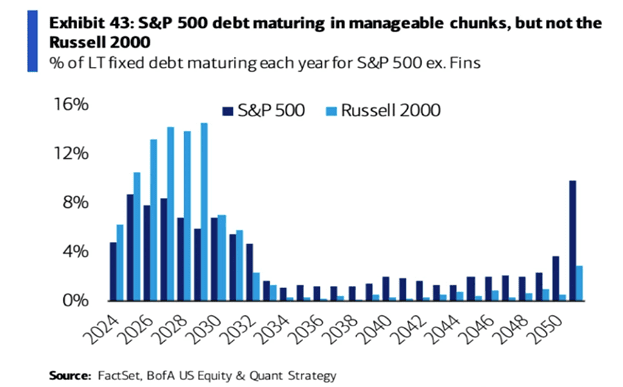
Image source: BespokePremium.com
It is also true that these companies are most vulnerable, or sensitive to macro-economic factors. It is estimated that nearly a third of the Russell 2000 constituents do not even have positive earnings. Additionally, the sharp rise in interest rates over the last two years will have a disparate impact on these companies as the bulk of maturing low-interest debt being rolled into much higher interest rate burdens lies on the balance sheet of the Russell 2000—not the S&P 500. So while the bulk of the media’s attention is on large cap indices and names, we have spent considerable time and “ink” over the last six-plus months focused on what could be the most important “canary in the coal mine”, the Russell 2000, as a better indicator of just how well the economy is doing.
We can’t turn our eyes away from continued positive data, rear-view mirror as it is. “While various measures of consumer sentiment have been weak and concerns over the economy have not completely faded from the dashboard, the US consumer keeps chugging along at a pace surprising economists”, says Bespoke Investment. December was the sixth straight month that headline print exceeded expectations in Retail Sales, going back to 2001.
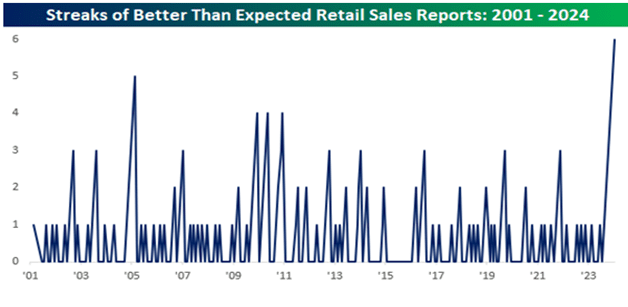
Retail sales are important because consumption accounts for 70% of GDP in the US. We are struck by the inability of most analysts to pinpoint the source of this surprising strength in consumption. As we have pointed out before--housing costs are sharply higher for many, credit card debt is as high as it's ever been, and while the rate of inflation growth has come down—prices for most goods, including groceries, remain far elevated relative to three years ago. Add to this the “Buy Now Pay Later” trend (which is debt, of course, but does not show up in the credit card numbers), and it’s difficult to see how consumers aren’t extended.
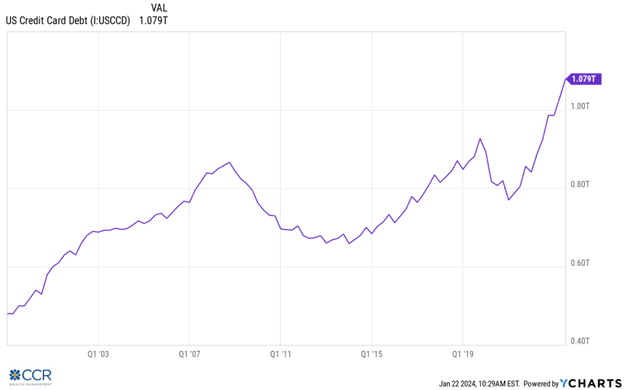
Most analysts have cited to some degree the likelihood of remaining (but dwindling) COVID transfer payments as the source of consumption strength, though this is very difficult to quantify. Our take on all this is exceedingly simple. Using rearview mirror retail sales as a justification for a bullish economic outlook is as illogical as buying a stock because it went up 30% last year. It doesn’t stop investors from doing it—behavioral finance has disaggregated this behavior extensively. We believe retail sales will eventually intersect with gravity, the way Russell 2000 balance sheets will. The question, of course, is when? In musical chairs, we never know when the music will stop. But we know it will stop.
Of some concern is what has become of the Russell 2000 rally that started late but capped the year impressively in 2023. While we don’t place great emphasis on very short-term moves, we still think it notable that in the opening weeks of 2024, we have seen a reversion to the trend that characterized much of last year. The Russell 2000 is down 4.05% since the beginning of the year as we write, while the S&P 500 is up 1.88%, and the M7 up 3.78%.
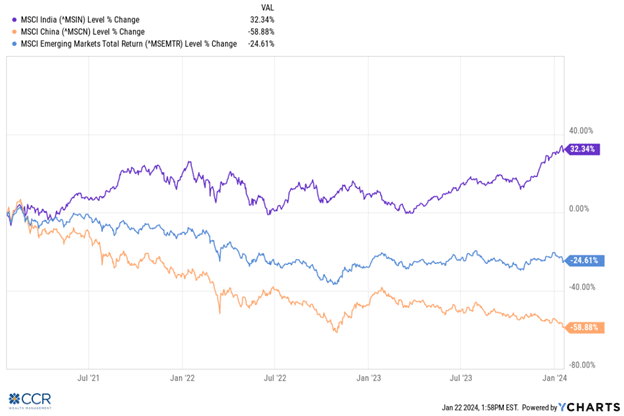
One salve to the multiple paradoxes this market presents is diversification. CCR Wealth Management’s Strategic models have expanded into non-US equities recently, and in 2023 we further expanded our emerging markets exposure. In fact, early this year we even augmented our holdings with a modest position in the Japan country index. In a 60/40 configuration, our Strategic model now holds roughly 27% of equities outside the US, a far larger allocation than we’ve had in well over a decade. Approximately 40% of this non-US equity allocation is in Emerging Markets, with the bulk of this exposure centered on India.
“Emerging Markets” is a catch-all term; however, this market segment has transformed greatly (and continues to transform) from its advent in the early 1990’s. For example, China has been the dominant story for much of the last 20 years as market reforms attracted massive foreign investment and the country became a manufacturing powerhouse which gave rise to a middle class. Unfortunately for this middle class (and those aspiring to it), reforms in many cases which attracted this needed foreign capital have been reversed. Today, China is most in the news not by being an economic growth story—quite the opposite. Capital flight (largely to Vietnam, India and other neighbors), economic contraction, debt bubbles/property bubbles, high youth unemployment, alliance with Russia and geopolitical tensions in and around the South China Sea dominate the news. As Walter Mead points out in a recent WSJ column, “fear of arbitrary state actions against both foreign and domestic businesses...are the result of government planning gone wrong.” Communism and capitalism were always strange bedfellows. But since Xi Jingping has placed his faith and efforts into shoring up the former, capitalism has last been seen fleeing to safer climes.
Meanwhile India has been a big beneficiary of China’s demise. With a population of roughly 1.4 billion (the world’s largest potential labor force), India is forecasted to become the second largest economy in the world in a few decades, perhaps sooner. Transitioning manufacturing bases from China to India will take many years, which gives us a degree of comfort with the “length of the runway”. But it is not just about manufacturing. The country’s government is focused on growth, making major investments in infrastructure, and positioning itself as a viable alternative to China in the global economic landscape. India’s home-growth healthcare and software industries have been growth drivers. Meanwhile, in Q3 India’s annualized GDP growth topped 7% year-over-year, topping expectations by a wide margin.
Another aspect of Emerging Markets today (or of many economies within this catch-all category) is the comparative adaptiveness of their central banks. We recall the conflagration of currency devaluations back in the 1990’s which was an eye-opener for many investors back then. But this isn’t “your father’s emerging market” universe anymore. While Jerome Powell, the Fed and other developed country central banks were dancing around the “transient” nature of inflation back in 2021, central banks in places like Brazil, Eastern Europe and Asia were aggressively raising rates to combat inflation. This divergence of monetary policy from the developed world helps illustrate the
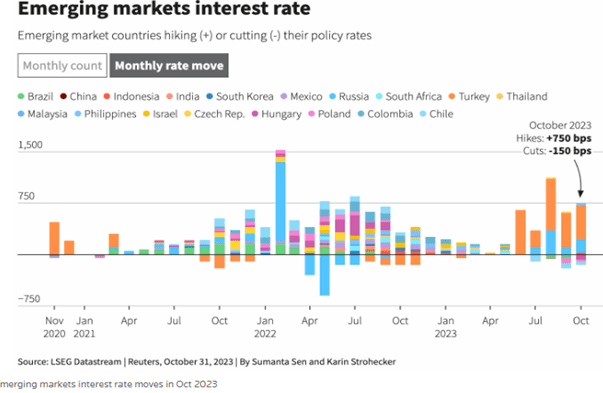
diversification value of emerging markets in today’s investment climate. Today—US stock investors have been salivating at the prospects of the Fed cutting rates later this year (more on this later). But central banks in developing economies have begun cutting rates in earnest in the second half of 2023, with more cuts expected in the coming quarters. In our view—it is not enough to say non-US stocks are “cheaper”, and it is not enough to point out that non-US markets are broader and less concentrated in certain sectors and companies. Those are interesting points—but for an actual catalyst, we can point to the divergence of central banks to make EM equity (as well as debt) investing quite attractive right now, and a viable alternative to the US paradox of mega cap, or no cap.
Lastly, on the non-US equity front it has been Japan, of all places, which has surprised to the upside. We are used to decades of stagnant returns and unmet promises of reform in this important, but idle economic engine of the globe. But reforms have been adopted and implemented at an increasing rate in recent years. The Japanese stock market experienced an extraordinary year in 2023 by several measures. Both the TOPIX 100 index and Nikkei 225 index saw an increase of over 30% in local currency, making the fastest expansion in a decade and the highest tally since the Japanese bubble economy in 1989. We anticipate that this momentum will persist. Goldman Sachs' outlook forecasts a 12% growth in TOPIX earnings per share in 2023, 8% in fiscal year 2024, and 7% in fiscal year 2025. This year's growth is expected to be driven by sectors recovering from cyclical downturns, such as electrical appliances, raw materials and chemicals, and machinery, as well as sectors including information and communication.
Our overall allocation to non-US equities today highlights that there are specific catalysts at play across the global universe that set up positive potential outcomes: divergent central banks, economic growth and market reforms. We can never say this or that region, country, or investment category will outperform the S&P 500 over this or that time frame. But given our outline of potential risk in US equities and the US economy, and frankly, the lack of much “choice” in US equity markets, geographic diversification today has much to offer aside from mere valuation comparisons.
At last, turning our attention to interest rates and the bond market, we will reach into the way-back machine to our Q3 2022 Outlook in which we described bonds:
“…we find ourselves in the unusual position of being somewhat excited about the return profile of much of the bond market these days. It has been many years since bonds have been poised to surprise on the upside—but it has been many more years since investors could receive an actual income stream while they wait!”
Since October 1 of 2022, our core bond fund has returned a cumulative 12.59% through mid-January of this year. Further, this return was achieved with a portfolio primarily allocated to short-duration US government-backed debt.
Understandably, many investors have discovered the attractiveness of cash and its various alternatives (CDs, T-Bills, ect) as an alternative to the volatility of the equity markets. No—the returns on the two don’t compare favorably, but as an alternative to stocks, at least investors were able to procure a positive real return. But cash returns, particularly those in US Government money markets, are very likely to see an erosion in 2024. This erosion will be caused by the inevitable reduction—at least to some extent--by interest rates at the short-end of the yield curve caused by Fed rate cuts.
While these cuts will result in reduced returns to money markets, CDs and the like, they will accrue as a benefit to actual bond holders. We feel strongly that bonds will continue to outperform cash (as they have for the last 12-18 months on a simple yield comparison). The prospect of lower rates ahead only makes the bond/cash comparison more favorable to bonds. Investors need not seek out long duration bonds or bond funds and should not seek out the extra risk embedded in a credit-heavy portfolio to achieve solid returns, in our view.
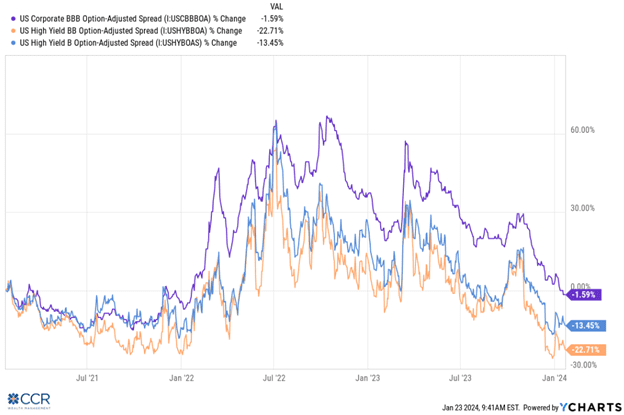
In past Outlooks we have mentioned that credit spreads are one area in which we have applied an extra layer of scrutiny. Spreads are a measure of value, and low spreads suggest low compensation for taking on high levels of credit risk (default risk). Here again, we have been “Waiting for Godot”. An open secret among investors is the precarious health across wide swaths of the commercial real estate market. But this risk isn’t simply confined to REITS (real estate investment trusts). REITs are not simply property managers; they are financial instruments. Real Estate is almost always a leveraged investment. Leverage is almost always provided by a financial institution. Dwindling occupancies (“return to the office” has been a disappointment) and low-interest debt maturing provide a potentially double-negative to not only the owners of commercial property, but straight up the “food chain” to the banking sector which relies on the timely payment of interest and principal on their loans. We use the real estate analogy in conjunction with our previous discussion of leverage within the Russell 2000 small cap equity index and credit spreads to illustrate why we remain cautious on credit, even while we’re generally bullish on the bond market.
One area we have been able to maintain a consistently accurate, if not prophetic outlook for the last couple years has been our resistance to the “rate-cut” narrative which has been implicit among Fed watchers. There has been a clamoring for (first) an end to the Fed’s interest rate hikes and (second) the beginning of monetary easing going as far back as June of 2022, long before the Fed’s final rate hike last summer.
Today we acknowledge the likelihood that 2024 sees an easing cycle by the Fed here in the US, and perhaps across the developed economies globally. The primary source of our certainty on this is the Fed itself. The Fed’s “dot plot” released after the December 13 FOMC meeting shows a preponderance of forecasted rate cuts for the year.
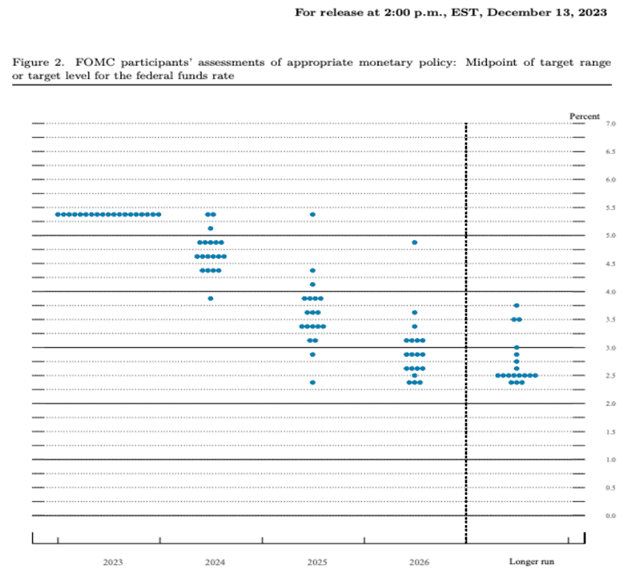
Image source: https://www.bankrate.com/banking/federal-reserve/how-to-read-fed-dot-plot-explained/#key-benefits-of-reading-the-fed-s-dot-plot
Another reason is that most members of the Federal Reserve Board of Governors (policy makers), including Chairman Jerome Powel, have referred to financial conditions as “tight”, or “restrictive”. We think this is an arguable point, given that equity prices are higher, and credit spreads are lower since the last rate increase in July, and investor sentiment is generally bullish. But surely the Fed has inputs beyond what the capital markets display.
According to CME Groups Fed Watch, investors have established expectations for as many as 7 quarter-point rate cuts this year, beginning in March (expectations reflected in the futures market). Here, we are once again at odds with the consensus. This would be a reduction of 1.75% on the front end of the yield curve (and even more negative for cash holders than our outlook).
A recent speech by one Fed Governor, Christopher Waller, did cause a hiccup in markets as the comments were viewed as more hawkish than the consensus anticipated. In it he said,
“When the time is right to begin lowering rates, I believe it can and should be lowered methodically and carefully. In many previous cycles, which began after shocks to the economy either threatened or caused a recession, the FOMC cut rates reactively and did so quickly and often by large amounts. This cycle, however, with economic activity and labor markets in good shape and inflation coming down gradually to 2 percent, I see no reason to move quickly or cut as rapidly as in the past”.
Of these comments we see two things perhaps the consensus is missing. The first is that a general comfort with the economy (soft landing consensus) is not consistent with aggressive rate cuts. The second thing we see missed by the consensus, implied by Waller’s willingness to be patient, is perhaps the memory of our last bout with nasty inflation metrics in the 1970’s. We touched on this in our Outlook last April, and we reproduce the same graph we used then.
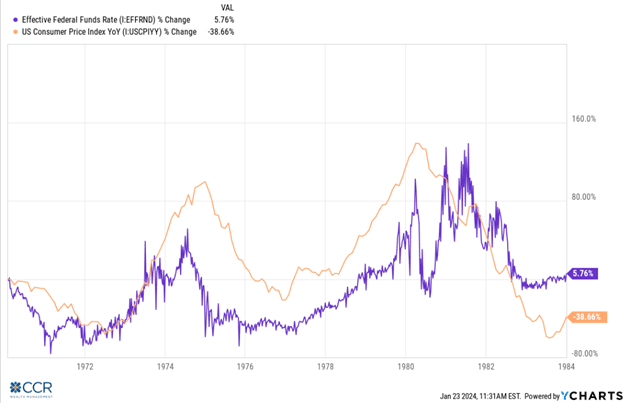
As the Arthur Burns Fed of the 1970’s learned, aggressive policy easing on the heels of falling CPI can easily reignite an inflationary spiral. In contrast to the consensus, and more in-line with the Fed Dot Plot, we see three to four quarter-point cuts ahead for the year. Of course, we would expect more rate cuts if out-of-consensus concerns like those we harbor began to manifest in small caps (employment) or credit (financials) as the year progresses.
Follow us on social media for more timely content delivered directly to your news feed!
