January 2022 Market Outlook
Happy New Year! Can’t be any worse than the last year, right?
Reminiscing on the surreal qualities of 2020, we recall a feeling of hopeful anticipation just one year ago. Three new vaccines and the “promise” of near-herd immunity by July brightened an otherwise dark first quarter of 2021.
A year ago, we read with interest a piece by Capital Economics which asked the question, “will governments around the world return the extraordinary powers they have been granted” during this pandemic? We are paraphrasing the question here, but Capital Economics produces excellent non-partisan macro-economic research, which is one important source that informs CCR Wealth Management’s outlook and investment opinions. Twenty-one months into this pandemic, and the question still begs an answer.
Yes, the pandemic has touched all our lives. Government responses, largely beneficial in the beginning, have also reached into every aspect of our lives and livelihoods, and the benefits have become much less clear as time has worn on. From the prices we pay at the pump and at the grocery store—the large changes we have all endured have their origins in Washington DC and in State Houses around the country. Sources of the information we all consume, formerly known as the “news media”, have become arbiters of “science” instead—with zero qualifications for such a role. In the process, they have made zealots or skeptics out of many of us (sells more ads). YouTube, Twitter and Facebook (the largest media enterprises in the world) have all engaged in the censorship of learned, thoughtful opinion which deviates from the approved talking points, no matter the contradictions, omissions, or about-faces those talking points have undergone in the last year and a half (or even the eventual validity of some opinions previously “canceled”). Throughout history Americans have been treated to a plethora of “crackpot” opinions and theories—and somehow, we survived and even thrived without the protection of censorship.
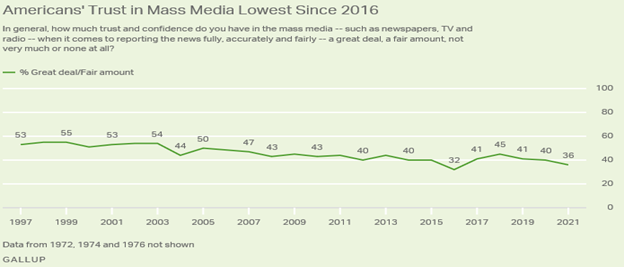
We find censorship repulsive because we believe in the free exchange of ideas, in the wisdom of crowds, and ultimately in the collective judgement of a well-informed public. This is largely why so many of us have entrusted a certain amount of our hard-earned net-worth to the markets. They don’t always make sense, occasionally go off the rails—then quickly correct. But ultimately, free markets do not suffer fools for long. Expert analysis can help inform and guide us along the way—sometimes it is right, frequently it is “right enough”, and sometimes it is wrong. But analysis and opinion do not change the outcome. Analysis and opinion cannot dictate market returns. Rather, right or wrong, they enrich the journey through education, based on their successes and failures.
Ultimately, we get the sense that 2022 will be a year of change. Change is afoot in the markets, as we discuss below. 2022 is a mid-term election year, of course, which also brings change, often. It would not surprise us if change were also afoot among the public’s perceptions of the power they have granted to governments. “Science”, as it has been presented to us, has lost its mystique, its air of infallibility, and perhaps some of the patience it has been afforded by the public. Depoliticizing the evidence may be the biggest change of all—we can only hope.
Of Cycles and Patterns:
We wrote last January, and again in June, about market cycles (the patterns markets exhibit between recessions). We floated two different ideas, one in each Outlook—so readers can be excused for being confused, but this has been one confusing market cycle! January 2021’s Outlook highlighted the outperformance of small cap stocks in the preceding months as likely indicative of a new market cycle, as it is one general pattern of early-cycle equity market performance (it also made sense given our recent emergence from a recession). But by June, we questioned this assumption by citing the (then) outperformance of value stocks relative to growth stocks, as well as rising interest rates at the time— patterns more indicative of later cycle markets. We blamed the unique circumstances and confusion on an intentionally-induced recession in 2020—one that may have displaced millions of workers, but that left few economically dislocated, contrary to normal recessionary patterns.
With more evidence at hand, naturally, we have re-examined our assumptions, and with their evolution we can claim greater certainty. We believe the markets have entered the “late stage” of a typical market cycle. Please note that late stage sounds more ominous than we intend—we are talking about markets, not a patient! Markets can and do spend years in this phase. Our observation is derived from several concurrent patterns rather than one or two, all of which support the late-cycle conclusion. We discuss four of these indicators below.
1) Market Caps:
Late market cycles are usually led by large-cap stocks outperforming small cap stocks (early cycles are led by small caps). While small caps outperformed large caps in 2020 and into last year, we saw a significant drop-off in relative performance in late summer, and ultimately the S&P 500 outperformed the Russell 2000 in price return in 2021 by over 13%, as indicated by the S&P 500 and the Russell 2000 indices below.
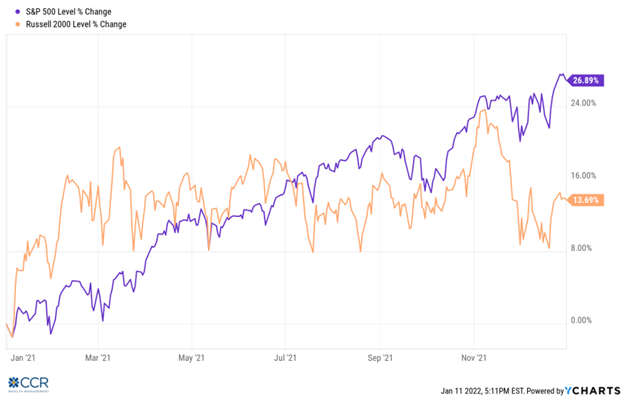
This is not to say we won’t encounter periods of small cap outperformance—we just do not believe it will be a long-term trend.
2) Inflation:
Another very consistent trait of late market cycles is that of rising prices. It does not matter the cause of inflation. Every inflationary period in this country and around the world all have their specific origins—whether in the Weimar Republic, the oil embargo of the 1970’s, or the housing bubble fifteen years ago. The fact remains that rising inflation has accompanied each late-market cycle in the post-war era, ultimately until that cycle ends in recession (as indicated by the grey bars in the chart below).
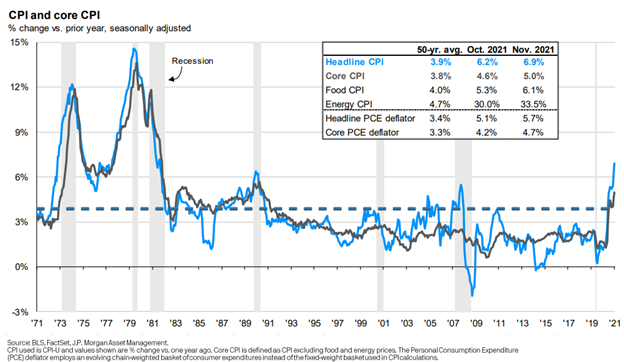
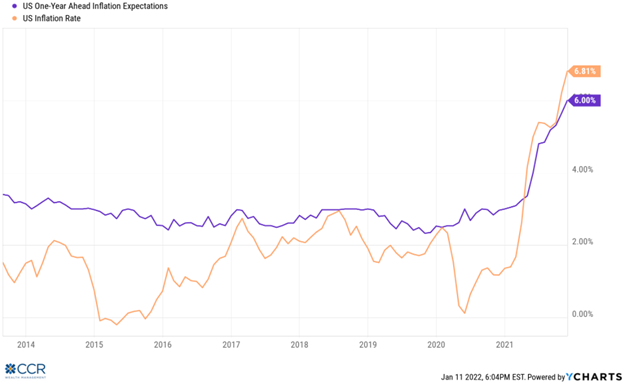
Certainly, inflation has been a concern and a topic of policy debate in this country for much of the last year. Headline CPI in December (7.00%) has reached levels last seen in the early 1980’s. Below, we have included CPI against a University of Michigan survey of year-ahead inflation expectations. Our own expectations include a significant reduction in inflation from current levels (more on this later); however, given the structural changes in the labor markets (and the general “stickiness” of wage growth and housing prices), we expect prices to remain above pre-pandemic levels for a long time—probably through the end of the cycle.
3) Interest Rates:
Late market cycles are also marked by rising interest rates and steepening yield curves. 2021 was a curious year in that interest rates (as represented by the 10-year US Treasury rate) rose sharply in Q1, from below 1% at the year’s beginning, to above 1.75% by the end of March (a near doubling of this rate). We attribute this to our aforementioned enthusiasm about vaccines, “re-openings” and a return to normalcy. But rates then steadily declined into the summer as hopes of “normalcy” were replaced by concerns over “Delta”. It is the appearance of inflation later in the summer, no less, that had investors bidding up the yield on this benchmark again, by bidding down the value of a fixed-return investment which results in a loss after inflation is taken into account.
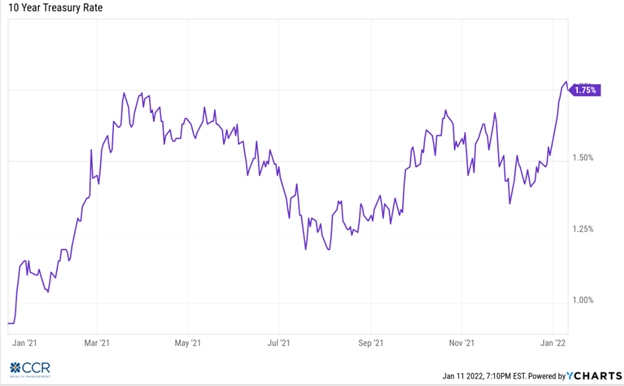
We include the first weeks of 2022 in the above chart to show the effects of sustained higher inflation into December, as well as the effect of Fed Chairman Jerome Powell’s November testimony before Congress has had on this benchmark interest rate. An accelerated tapering of quantitative easing, and the removal of the “transient” moniker describing the Fed’s inflation outlook appears to have focused the minds of bond investors—at least somewhat!
One odd aspect of the path this interest rate benchmark has taken is that it seems, in some ways, that equity markets have taken the prospect of higher interest rates into account more than the bond market itself. Below, we discuss the reaction of banks and financials, as well as growth and value stocks to the prospect of higher rates ahead. But when bond yields were topping out at 1.75% in March, the Fed wasn’t even appearing prepared to change its easy-money approach. Now that the Fed has acknowledged inflation, accelerated the winding down of QE, and even floated 2022 interest rate hikes, the yields have risen again but still seem stuck at these levels.
The shape of the yield curve also matters! We used the term “steepening” as one which describes the actual difference between longer-term rates and shorter-term rates. In general, higher interest rates farther out on the yield curve are not a bad thing! There is likely too much nuance in the discussion of interest rates to get too deep into in this discourse, but higher rates further out can generally be seen as a forecast of robust economic activity (investors demanding a higher fixed rate of return à consistent with a healthy economic return environment à a real return that beats inflation which (at some level) is historically expected in a strong economy). Yup—way too complex for this discussion.
A steeper yield curve is one where the difference between longer-term rates and shorter-term rates is greater. In short, a steeper yield curve gives more validity to the positive aspects of a higher longer term interest rates. (Got that?) The distinction along the upward sloping yield curve has more economic credence. This is particularly true for banks!
For banks whose primary business is loaning money, a steeper yield curve is a positive economic indicator. Loans they make are assets (because they make the bank money). Deposits are liabilities (because they cost the bank money in the form of interest paid on savings accounts, CDs, etc.). “Net interest income” is the primary source of lenders: interest earned (on higher yielding 10-15-30-year loans), minus interest paid to depositors is greater when the curve is steeper. Generally, throughout history, a healthy banking sector is indicative of a healthy economy.
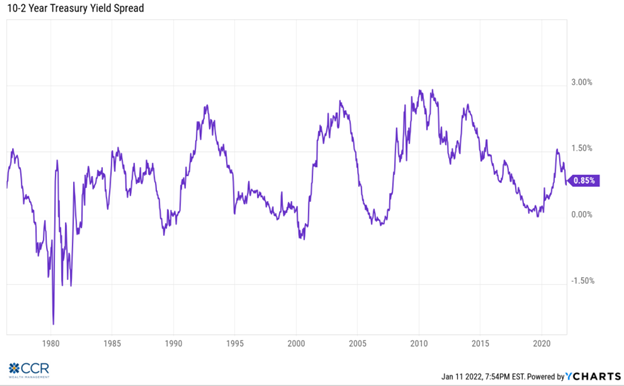
The chart above depicts the forty-year history of the spread between the 10-year Treasury rate minus the 2-year Treasury rate, which is one indicator of the steepness of the yield curve.
If you know your history, you will recognize that this spread is narrowest, and sometimes negative, (depicting and “inverted” yield curve) just before recessions (1980-82, 1989-90, 2000-01, 2008-09). Conversely, it is rising the fastest during economic expansions.
We zoom-in on the last three years of this chart to discuss expectations of the yield-curve steepening. “Quantitative easing” is a relatively new Central Bank phenomenon first exercised by former Fed Chairman Ben Bernanke and adopted thereafter by the European Central Bank and others. It involves purchasing massive amounts of outstanding and new-issue bonds of varying types—mostly government, including mortgage-related—at certain maturities. The purchase of these bonds creates a sort-of synthetic demand (prices rise, bond yields fall), which keeps a lid on how high longer-term rates can/will rise. Theoretically, keeping longer-term rates low enough to keep a housing market healthy underpins a strong economic recovery (mortgage rates these days are highly correlated to the 10-year Treasury rate). And theoretically, the Fed has “unlimited” buying power—so “don’t fight the Fed” has Wall Street falling in-line with this synthetic yield curve.
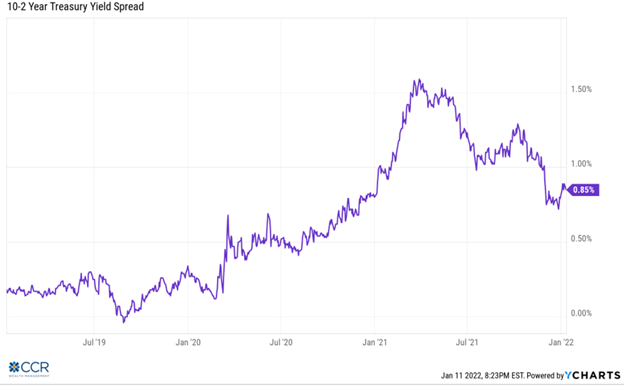
Notice the small upward “hook” on the right side of this chart. We see the 10 minus 2-year spread go from 72 basis points (0.72%) to 85 basis points (0.85%) in only the last few weeks. These may seem like small numbers, but they actually represent good-sized moves of an already low interest rate. This has also coincided with a rise of over 17% in the S&P Banks Select Industry Index in just the last few weeks, as depicted by the graph below.
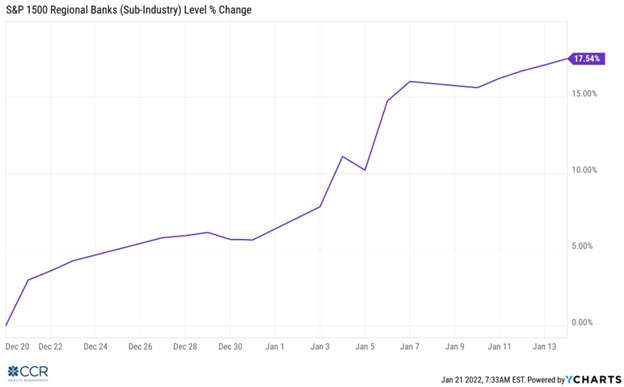
We point this out because, as you have no doubt heard, equities are a decent forward-looking indicator. And without the Fed’s buying-power suppressing longer-term rates in the months ahead, we think further steepening is likely.
4) Growth and Value:
Lastly, and still on the topic of late market-cycle indicators, we turn to the issue of “growth vs. value”. While this topic gets much airtime in the media, the discussions are often too simplistic. We parse the difference between value and growth stocks into the ideas of “quality vs. concept”, or “a bird in-hand is worth two in the bush”. Over the last year we have been asked more than once why growth stocks (technology, biotech, gaming, internet-related, etc.) seem to suffer so much more when interest rates rise. Is it because they have a lot of debt and their cost of borrowing rises?
In truth, the cost of capital (including debt) remains historically very low for just about all companies. It would take a much more significant—and prolonged—move up in rates to have much impact on a company’s ability to service debt. To understand the correlation between stocks and interest rates, and more particularly high-growth stocks and interest rates, there is some math involved. Financial assets are valued by discounting all future cash flows back to the present. The “discount rate” has at its base the “risk-free rate” (this is a Treasury base rate, which is then conditioned to account for other risk factors). This is the denominator in the equation. There are several variations of this formula, but here is a simplified version of a Discounted Cash Flow (DCF) formula
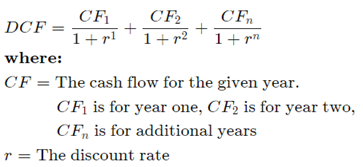
The difference between CF1, CF2, and CFn is the rate of growth of a company’s cash flows (cash flows could be measured with dividends, earnings per share, free-cash flows to equity holders or other metrics). r is the discount rate (again, at its base is the appropriate Treasury “risk-free” rate). As we have pointed out in other contexts, when the dividend in your fraction goes up, you have a smaller number. But holding all else constant, when you are expecting a larger percentage of your cashflows further out on the time horizon (as with a high-growth technology company), you are discounting more cashflows at the higher rates for longer than if you expected only moderate growth to your cashflows. This is why growth stocks are so susceptible to higher interest rates as compared to their more moderate growth “value” counterparts.
The discount mechanism compounds two other conundrums which face growth investors. The “bird in hand” thinking holds that forecasting cashflows further out (say, five, seven or even ten years into the future) is more difficult, and likely more fraught with error than simply forecasting next year’s (or next quarter’s) cashflows. The greater uncertainties down the road, then, are being discounted at higher rates (and for longer)—further highlighting the risks to the forecast. In contrast, companies in mature industries with low but steady growth rates (consumer staples, industrials, utilities, etc.) have more certainty associated with their forecasted cashflows (often, a dividend discount model is used). These companies are the “bird in hand” that investors tend to gravitate to when rates rise, and uncertainty becomes more costly.
Lastly, our quality vs. concept idea also relates to the higher cost of uncertainty with higher interest rates. “Concept” stocks are often new, or newly public companies (IPOs), with little to no positive cash flows—sometimes even trailblazing new industries.
One point we wish to convey here is that growth stocks are not dead! But quality, measured by positive cashflow, should be scrutinized by investors. “Concept” stocks sell an idea of positive cash flows at some far-off date, with revenue often the only positive financial metric available. We expect most of these companies will no longer be celebrated by Wall Street as interest rates march upward.
CCR Wealth Management’s Outlook:
We have now “set the table” in our discussion of a market-cycle transition. We have written often that investors should not seek to change their strategies just because the calendar changes. But since we are clearly talking about real change here (and it is January), we would point out that many of the charts you’ve seen up to this point go back to November, October, and September. Indeed, change has been afoot in the markets for months, and we have taken steps along with it—with more to go.
Our first expectation of 2022 is an increase in equity volatility. In fact, this is not a stretch to forecast. As we have pointed out many times, 0% interest rates, coupled with quantitative easing acts like a wet blanket to smother market volatility. Nearby is a chart of the maximum drawdown of the S&P 500 over the last 14 months. Below that is a similar depiction of S&P volatility (along with annual returns), shown annually going back 41 years.
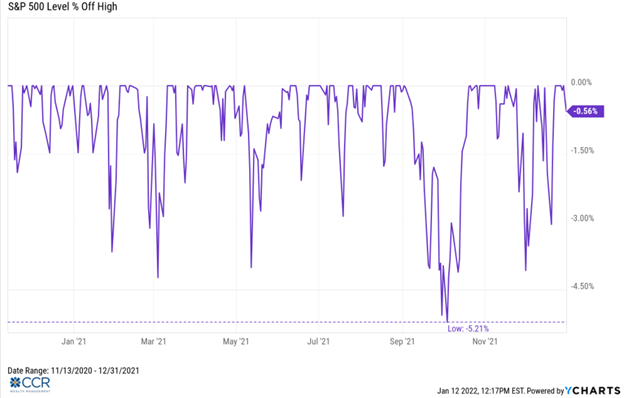
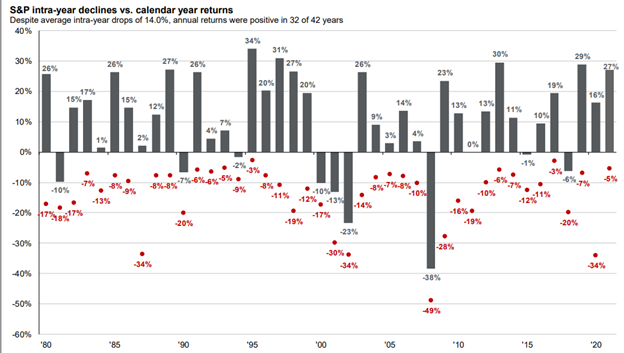
Over the last 14 months, we have seen a maximum draw-down in the S&P 500 of just over 5%. Clearly, this is not the norm! With the end of quantitative easing nigh, and at least two rate hikes ahead this year, the warm, wet blanket will give way to the chillier climes of more normal market volatility. Importantly, CCR Wealth Management sees market upside ahead! Historically (back to 2009—in the age of the Fed’s modern balance sheet), higher interest rates have not been a statistically meaningful detractor to equity returns until the 10-year has breached 3.6%. Prior to 2009, and going back to 1965, stocks and interest rates have generally moved in the same direction until the 10-year Treasury rate hits 4.50%. While GDP growth is expected to slow (we think just under 4% is likely for 2022), even at lofty valuations we see runway ahead for US equities… just accompanied by more volatility.
Last year CCR Wealth Management began to reduce the significant overweight we held to large-cap growth stocks. In the end, we remained overweight in growth vs. value—having resisted the narrative in 2021 that this outperformance of growth had come to an end (for the record, in 2021 the Russell 1000 growth index outperformed the Russell 1000 value index by about 2.50%).
We are (and have been) pulling our portfolios harder in the value direction today. We will seek more parity between growth and value as we enter this stage of the market cycle, and in some instances, investors may notice larger shifts to value-oriented funds or indexes than they anticipate. This is due to the structural anomaly of the S&P 500 (which most of our clients own as their “core” blended holding). Because the market cap of this major index is dominated by massive technology companies (think: FANGs), many investors don’t realize that simply owning the S&P 500 tilts the portfolio to growth. This is because the US economy tilts towards growth. To emphasize a desired increase to sectors like banking, financials, industrials, and other “value” sectors, we need to overcome the large tug of technology within the S&P 500 itself. Below is the weighting of the S&P 500 by style and market cap which shows this bias.
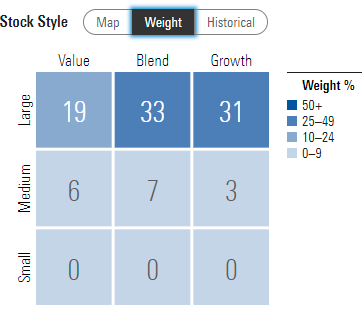
Also consistent with our outlook on the change of seasons within the market cycle, we will be looking to reduce exposure to small caps for those clients who are overweight. Our desired allocation is between 7% and 9% of equities.
Non-US Equities:
We think we may be entering into an interesting time with non-US equities, and this thought relates to our discussion of growth vs. value above. Often, news out of China will prompt client questions—to which we reiterate a few points:
- The Mathews fund is our only discrete allocation to emerging markets.
- It is not a “China” fund, though China is currently nearly half of the allocation—it is an Asian
- China, the world’s second largest economy, is large and diverse.
- The fund allocation to India has nearly doubled within the last 12 months.
Below are two charts to consider before accepting as “gospel” the media’s narrative of Chinese stocks, or even the broader description of Emerging Markets.
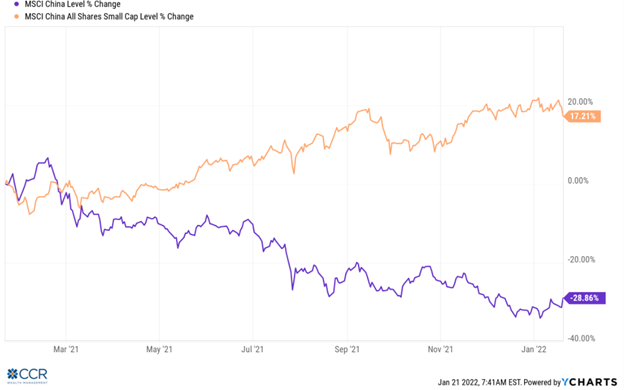
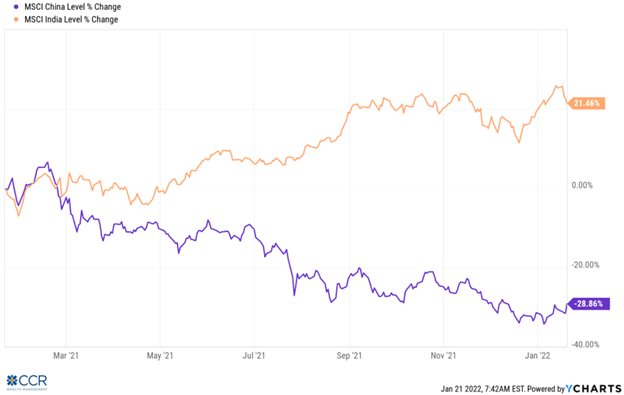
As is made clear, there is an extremely wide divergence between the performance of fast growing EM countries like India, relative to China, or even the MSCI Emerging Markets Index (down 4.59% last year). India’s fast developing digital economy, deep talent pool, and pro-business government policies have created great opportunity which is reflected in the markets.
“Me too” media stories about the Chinese property market, slowing growth, etc., are surpassed only by the focus on geopolitical issues (rarely a good investment barometer). We treat this investment opportunity set as we would a US allocation: look at the investment climate, demographics, economic trends, and macro-economic probabilities. Had we focused on the “trade narrative” a couple years ago, we would never have invested in the fund. We maintain our position in the Mathews fund and handicap a better than even probability that:
- The PBOC will likely cut key interest rates at certain maturities in 2022 (perhaps along with other monetary easing measures).
- We have seen “the worst” of China’s abrupt regulatory announcements (a supposition we floated last summer).
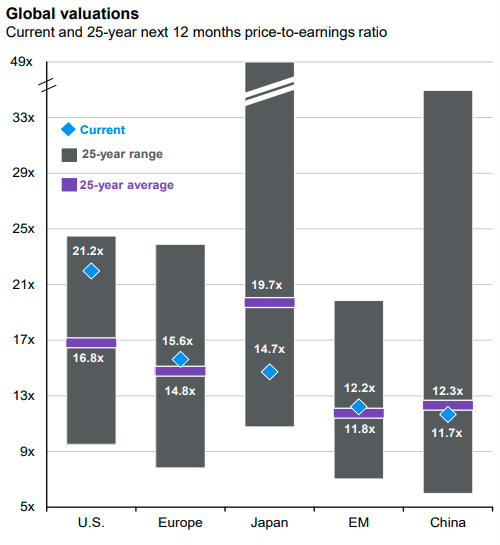
- Valuations are very attractive compared to their 10-15- and 25-year averages.
Turning our attention to Europe, the FTSE Europe Index returned roughly 17% last year. Our clients got little more than a mid-single digit return, owing to our entry in mid-May (most gains having been made in Q1). We have always been of “two minds” when it comes to Europe, and in a recent call with CCR WM advisors we reminded them that our concern was the “value-trap” potential of the allocation. Still, we deemed it prudent based not only valuation differences but on the principals of diversification.
We are more intrigued with European prospects today than we were even eight months ago, given the global rising real yields… though we have no plans to increase our index allocation just yet. First, let’s consider the structure of the FTSE European Market’s index (and compare it to the S&P 500 above):
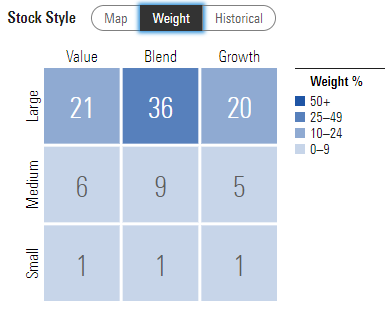
Europe’s propensity to play regulatory “whack-a-mole” with their burgeoning technology industry over the last two decades has left their governments with much less in terms of corporate tax receipts—though it seems their governmental strategy recently has been to litigate the difference from US tech companies. In all, however, we see a much more balanced market structure, possibly enduring higher global yields with less volatility given the absence of a major technology base. This is not to say that Europe doesn’t face challenges. They face the same challenges that afflict the US and the rest of the world including COVID-19 variants, supply-chain issues, and rising inflation. They also face a few challenges unique to them, including increased exposure to higher energy prices this winter (especially in Germany, the region’s largest economic contributor). All that said, here is what keeps us engaged:
- Valuations are appealing, especially when compared to US equities. 28% of listed European equities have a P/E ratio of 12 or less.
- A rise in global real yields distinguishes opportunity in value everywhere, not just the US. Europe is the “value capital” of the world.
- We expect the ECB to be much less aggressive than the Fed in dealing with inflation.
- Asset managers have been overweighting allocations (and recommendations) to Europe more aggressively since last summer. On this point, being in the consensus makes us nervous. On the other hand, an increase of expected fund-flows can’t hurt us.
From a recent Bloomberg article:
Jefferies strategists led by Sean Darby, meanwhile, said on Monday that “Europe is back,” citing dovish central banks and the rollout of a commonly-financed pan-European fiscal stimulus next year.
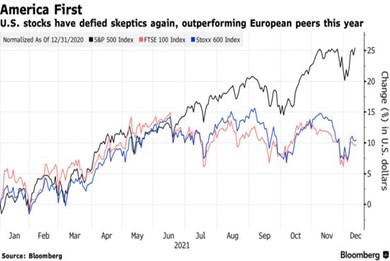
While some strategists have been betting on Europe’s outperformance for years thanks to cheaper valuations and a more cyclical market, these calls have rarely come true. The region’s equities have trailed the U.S. for the best part of the last decade, with U.S. stocks defying concerns about stretched levels.
Valuations are also part of Deutsche Bank’s call to overweight Europe in 2022. Price-to-earnings multiples in the region are about 20% below pre-pandemic highs, while those in the U.S. are about 10% above, according to Bloomberg data. “Europe is trading at a discount even after adjusting for the mega-cap growth and tech companies,” the Deutsche Bank strategists wrote.
And the two firms are not alone in their optimism. Citigroup Inc. strategists led by Beata Manthey said Monday that rising earnings should keep European equities moving higher. Morgan Stanley prefers European equities over those in the U.S., while the end-2022 targets set by Goldman Sachs Group Inc. strategists for the S&P 500 and the Stoxx 600 imply more upside for Europe.
No one we know would accuse us of being “Europhiles” when it comes to investing. Europe’s underperformance of US markets has been pronounced, and consistent over the last 15 years. Most of this stems from a lack of any meaningful leadership in technology. But, if we are discounting tech’s contributions to future returns, then Europe’s status as a diversifier gains credence.
In summary on non-US equities, we will rest our case with this graphic:
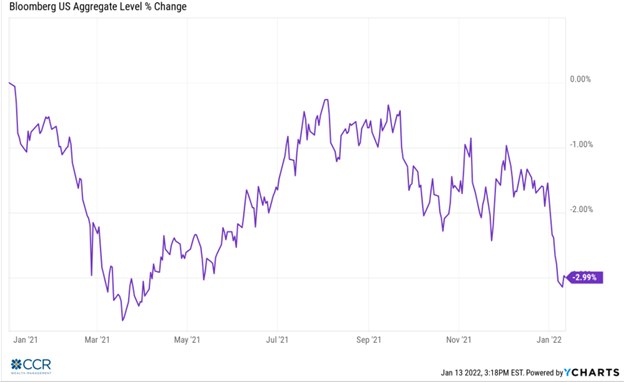
Now pivoting to Fixed Income, while we repeatedly tell our readers that “CCR Wealth Management is not in the prediction business”, we remind that our September 2020 webcast commentary informed our clients that the future of fixed income was bleak. In fact, the trailing total return of the broad-based Bloomberg Barclays Aggregate Bond Index over the last 12 months is down 2.27% (in total-return metrics—so this includes interest paid). The chart below shows the price-return (excluding interest) for last year, into the first 2 weeks of this year (note that previous charts have shown interest rates, which move opposite to prices in the bond market).
Jerome Powell’s recent testimony in front of congress has turned decidedly hawkish on inflation. Still, we find it odd that as we write the Fed is continuing to buy bonds in the face of 7% CPI Inflation (though tapering this program). The glide path for interest rate hikes appears to begin in March or April. Consensus has recently adjusted to expect 4 rate hikes in 2022. Our expectations for rate hikes have also risen, however we remain below consensus for a few reasons:
- The Fed’s forecasts of GDP are usually too optimistic. It’s easier to be hawkish when GDP is above 5%. But as slowing economic evidence arrives, aggressively raising rates will be more difficult.
- We think Inflation has peaked or is in the process of peaking. Supply-side disruptions are slowly working themselves out. The monthly Child Tax Credits that were going out to approximately 35 million families since July expired at the end of December after Congress failed to renew it. Other “pandemic fiscal relief” provisions are tapering, and in our opinion, the Build Back Better legislation is dead in the water. We think the Demand-side excesses will begin to taper in the months ahead. “Transitory” may finally arrive now that the Fed has abandoned the term. Make no mistake—higher inflation will persist, just not at current levels in our opinion.
- It is an election year. While not a Presidential election, we have noticed various Fed officials seem to tailor their comments, depending on which political constituency they are addressing. Raising rates in the September-October period may prove too politically “uncomfortable”, especially if growth is slowing and CPI has moderated. We expect to hear the word “pause” introduced after three hikes.
Either way, rate hikes are coming. We continue to recommend investors adjust their return expectations rather than “chase yield” in riskier corners of the bond market, or even in so-called “bond alternatives” which simply add more equity risk to their portfolios. We already expect higher volatility in equities, as discussed, and adding more equity-beta to achieve yields that likely still won’t surpass current inflation rates is the opposite of the diversification that we seek. CCR Wealth Management’s investment philosophy stresses total return over income. Income is a component of total return, of course, but pursuing income at the expense of portfolio stability in what are likely to be bumpier markets could be a self-defeating strategy.
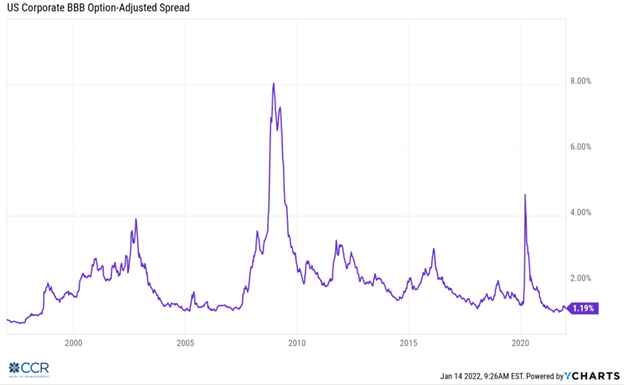
Corporate bonds have valuation metrics that compare their yields to comparable-maturity risk-free Treasury yields. This is known as the credit-spread. Again, yields and prices move in opposite directions. When spreads widen, as they do in times of market volatility or stress, the price of your non-Treasury bond portfolio is falling, sometimes sharply. In fact, as we have pointed out before, credit bonds are positively correlated to equity markets. Nearby is a ten-year look-back of credit-spreads for the BBB-rated credit market (the most crowded segment of the corporate bond universe). As you can see quite easily, a narrower spread than 1.19% only occurs back in the dot-com craze of 1997. This is not an environment in which we feel comfortable piling on more credit risk to a portfolio.
In general, municipal bonds did well last year on a nominal basis. As most states and municipalities are flush with COVID relief, the fundamentals of the municipal market remain strong. Tax-free bonds also tend to be a “stickier” asset class, meaning that investors tend to think twice before selling. We expect these traits to continue for the foreseeable future—though like the rest of the bond market, a real positive return (inflation-adjusted return) will likely remain elusive for the foreseeable future.
In short, we are and will remain defensively positioned in bonds, as we believe 2022 will be another challenging year. We prefer to seek the ballast bonds can provide rather than stretch for the income. The good news, if rates rise throughout the year, is that the outlook for bonds should improve next year.
This is not to say we shun credit—our current bond allocation contains core fund holdings which employ their fair-share of credit risk.
Our strategy has been and continues to be a focus on quality and duration in our bond portfolios outside of our core holdings. Years ago, we initiated a modest position in a Treasury Inflation-Protected Securities (TIPS) ETF. We doubled this position last March, and even as bonds “topped out” last summer, the inflation adjustment TIPS get (based on CPI) kept them in favor and kept their total return uniquely ahead of Inflation for most of the year. Sensing higher interest rates ahead, we swapped this position in early November for an ETF which holds the same securities, though with lower shorter maturities and a lower duration (going from an average of about 8 years to an average of about 2 ½ years). This was done in retirement accounts alone so as not to add to the already large taxable distributions we expected from many mutual funds. Early this month we swapped the remaining TIPS into their shorter-duration cousins.
While change is afoot in the markets, CCR Wealth Management manages our client portfolio measuring in feet, not yards. By this, we mean that abrupt, large-scale changes are a rarity. Investment management should reflect the humility one is invariably taught over decades of experience. We monitor and communicate with the portfolio managers we have entrusted with specific segments of our model portfolios, of course. We remain diversified and remain open to change based on evidence. We think 2022 will pose more challenges for investors than the last year—but ultimately, we look to forward to positive portfolio performance, in total-return terms.
Disclosures
Definitions
The STOXX Europe 600 Index is derived from the STOXX Europe Total Market Index (TMI) and is a subset of the STOXX Global 1800 Index. With a fixed number of 600 components, the STOXX Europe 600 Index represents large, mid and small capitalization companies across 18 countries of the European region: Austria, Belgium, Czech Republic, Denmark, Finland, France, Germany, Greece, Ireland, Italy, Luxembourg, the Netherlands, Norway, Portugal, Spain, Sweden, Switzerland and the United Kingdom.
The FTSE 100 Index is a capitalization-weighted index of the 100 most highly capitalized companies traded on the London Stock Exchange. The equities use an investability weighing in the index calculation and was developed with a base level of 1000 as of December 30, 1983.
The MSCI China Index captures large and mid cap representation across China A shares, H shares, B shares, Red chips, P chips and foreign listings (e.g. ADRs). With 739 constituents, the index covers about 85% of this China equity universe. Currently, This includes Large Cap A and Mid Cap A shares represented at 20% of their free float adjusted market capitalization.
The MSCI India Index is designed to measure the performance of the large and mid cap segments of the Indian market. With 106Üonstituents, the index covers approximately 85% of the Indian equity universe.
The Russell 2000 Index measures the performance of the small-cap segment of the U.S. equity universe and is a subset of the Russell 3000 Index representing approximately 10% of the total market capitalization of that index. It includes approximately 2000 of the smallest securities based on a combination of their market cap and current index membership.
S&P Select Industry Indices are designed to measure the performance of narrow GICS® sub-industries. The index comprises stocks in the S&P Total Market Index that are classified in the GICS regional banks sub-industry.
The Bloomberg Barclays US Aggregate Bond Index, which was originally called the Lehman Aggregate Bond Index, is a broad based flagship benchmark that measures the investment grade, US dollar-denominated, fixed-rate taxable bond market. The index includes Treasuries, government–related and corporate debt securities, MBS (agency fixed-rate and hybrid ARM pass-throughs), ABS and CMBS (agency and non-agency) debt securities that are rated at least Baa3 by Moody’s and BBB- by S&P. Taxable municipals, including Build America bonds and a small amount of foreign bonds traded in U.S. markets are also included. Eligible bonds must have at least one year until final maturity, but in practice the index holdings has a fluctuating average life of around 8.25 years. This total return index, created in 1986 with history backfilled to January 1, 1976, is unhedged and rebalances monthly.
Exchange-traded funds are sold only by prospectus. Please consider the investment objectives, risks, charges and expenses carefully before investing. The prospectus contains this and other information about the investment company, can be obtained from your financial professional. Be sure to read the prospectus carefully before deciding whether to invest.
© 2020 CCR Wealth Management, LLC
The views are those of CCR Wealth Management LLC and should not be construed as specific investment advice. Investments in securities do not offer a fixed rate of return. Principal, yield and/or share price will fluctuate with changes in market conditions and, when sold or redeemed, you may receive more or less than originally invested. All information is believed to be from reliable sources; however, we make no representation as to its completeness or accuracy. Investors cannot directly invest in indices. Past performance does not guarantee future results. Additional risks are associated with international investing, such as currency fluctuations, political and economic stability, and differences in accounting standards.
Securities and advisory services offered through Cetera Advisors LLC. Member FINRA/SIPC., a broker/dealer and a Registered Investment Advisor Cetera Advisors LLC and CCR Wealth Management, LLC are not affiliated companies. Cetera Advisors LLC does not offer tax or legal advice.
CCR Wealth Management 1800 W. Park Drive, Ste 150, Westborough, MA 01581. PH 508-475-3880 / 72 Queen St, Southington, CT 06489. PH 860-370-2270
Follow us on social media for more timely content delivered directly to your news feed!
