April 2025 Market Outlook
“May you live in Interesting Times.” — Sir Austen Chamberlain
Executive Summary
Markets in 2025 have seen a pullback after two strong years, reflecting a natural reversion to the mean rather than a crisis. Despite the correction, stock valuations—especially in tech—remain elevated, and market concentration poses risks.
CCR Wealth Management urges investors to refocus on diversification, valuation, and realistic return expectations. Historical data shows high valuations often lead to lower future returns. In contrast, bonds now offer attractive long-term potential with yields above 5%.
Our priority remains helping clients achieve their financial goals through prudent planning—not chasing returns or reacting to hype.
Outlook
So far this year, we have indeed been living in interesting times. The markets have been on a wild ride of late, and of course, hyperbole is in the air. The advertising business must be brisk.
Last July, our Outlook discussed the topic of mean reversion at length. We began it with a quote from Jimmy Cliff, “The harder they come, the harder they fall”. We concluded: “We do not pretend to know when—or by how much ‘the fall’ will occur. But we trust in reversion to the mean. As we laid out in January, our antidote is diversification.”
For the last two months or so, our e-mail inbox has been stormed daily with invitations to webinars, white papers, and all manner of analysis from all manner of “experts” designed to educate us and arm us with the tools we need to understand and navigate the new tariff regime. Finding needed levity these last few weeks, we have revisited a few of them, which have quickly become laughably irrelevant and obsolete.
No doubt you, dear clients, have been similarly inundated with copycat headlines predicting doom, gloom, and the end of the world as we know it. We will spare you further distress. As we pointed out in January, investors have enjoyed two back-to-back market years that have culminated in an S&P 500 return of greater than 57% in 2023 and 2024. We have seen a mild decline in most of (but not all) our diversified investment models year-to-date that stands out as neither a major setback, nor even remotely abnormal. In fact, we see reversion to the mean.
Some of you may be pining for the good ole days when the only news worth tuning into was the anticipated release of how many Blackwell GPUs had been shipped the previous quarter. We see much of the carnage in recent weeks focused in corners of the market highlighted and celebrated myopically by Wall Street and media narratives over the last two years, and this does not surprise us.
For us, the tale of the markets so far this year has been one of valuation, gravity, and as we have been harping on for two years, concentration. Below, we use JP Morgan’s Guide to the Markets publication to highlight the market’s forward P/E valuations at the end of last year, and most recently on April 10 of this year as they relate to the 20-year average of this valuation measure. Circled in red is the P/E valuation of the S&P 500.
As depicted, the S&P 500 ended last year trading at over 136% of its 20-year average P/E valuation. Indeed, the large-cap growth category was nearly 150% of its average valuation (think tech, AI, etc).

There is good news and not so good news here. The good news, of course, is that the recent correction in stocks has seen a significant reduction in the state of “over valuation”. The not so good news, however, is that despite the bloodletting, it still cannot be said that stocks are “cheap” here.
The case we will make going forward is that (many) investors may need to refocus attention to diversification, valuation, and assumptions of where returns will come from to power their financial plan. Many have been too busy “buying the dips” to question whether the media narratives surrounding artificial intelligence sounds suspiciously like the media narratives surrounding internet stocks in the late 1990’s (a topic we also addressed last July). No hyperbole here. No predictions. Just factual data.
In October of last year, a Goldman Sachs team led by David Kostin predicted that the S&P 500 return over the next ten years would likely be no more than about 3% a year. Setting aside our skepticism of predictions—let alone 10-year predictions—we think investors should take the empirical observations into consideration. Goldman’s reasoning for their forecast is summarized as “market valuation & market concentration”. Regarding the latter explanation, we have spilled plenty of ink in the last two years lamenting the dominance of the “Magnificent 7” embedded in broader index returns…along with investors seeming eagerness to engage in cognitive dissonance. Regarding the former, valuation, read on.
Using today’s forward P/E ratio of 19x for the S&P 500 and regressing it against market returns over 60-month periods going back to February of 1999 we can observe a sloped regression line which clearly indicates 5-year forward returns for the S&P 500 are negatively correlated with P/E levels (the higher the market’s forward P/E, the lower the 5-year forward returns have been).

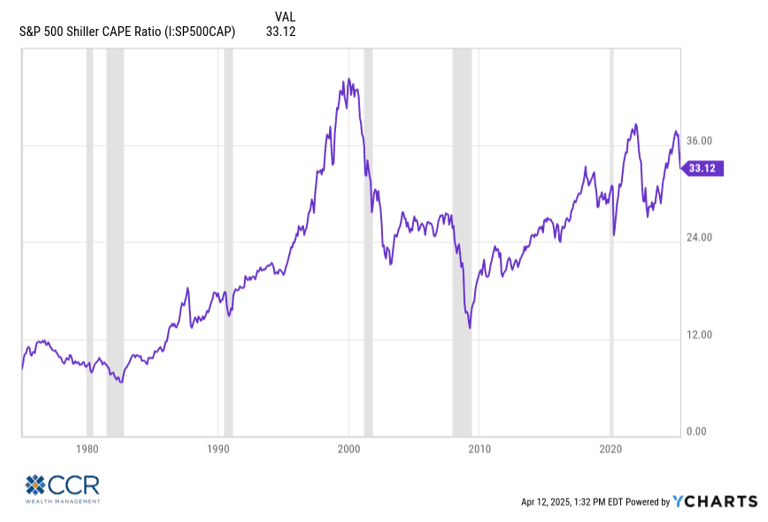
Below we depict the cyclically adjusted P/E ratio (commonly known as the CAPE Shiller P/E) over the last 50 years or so (this is just the P/E ratio where the “E” is a 10-year moving average, adjusted for inflation).

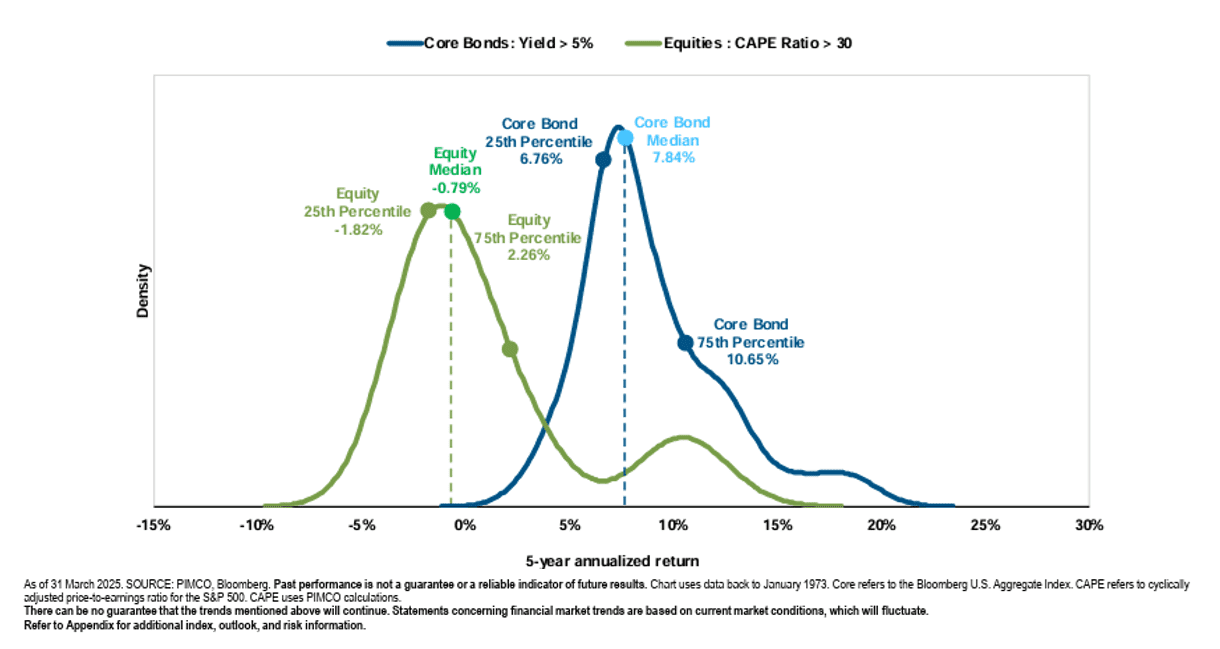
As depicted, this measure has come down from a level of over 37x earnings at the end of February to a value of 33.12x at the end of March. Below is a probability distribution of 5-year forward returns using S&P 500-derived CAPE data and Bloomberg US Aggregate Bond-derived data going back to 1973. All empirical observation here—no forecasts.

Again, our focus here is to invite our clients to reexamine return assumptions in a still-highly valued and concentrated market. Many investors have been conditioned to consider every market dip an opportunity. Recency Bias infects return assumptions, as does a myopic focus on a single sector narrative. The CAPE ratio was 33.12 at the end of March, down from over 37x at the end of February. Based on 52 years of observations, a CAPE ratio greater than 30 yields a 5-year forward return in equities significantly below those of recent memory. This is the foundation of much of Goldman’s forecast. Still chomping at the bit to buy the dip? Reviewing the longer-term chart of the CAPE, it was up to about 43x back in the Dot-Com bubble era. The Nasdaq 100 took 16 years to break even…that’s a lot of dip-buying.
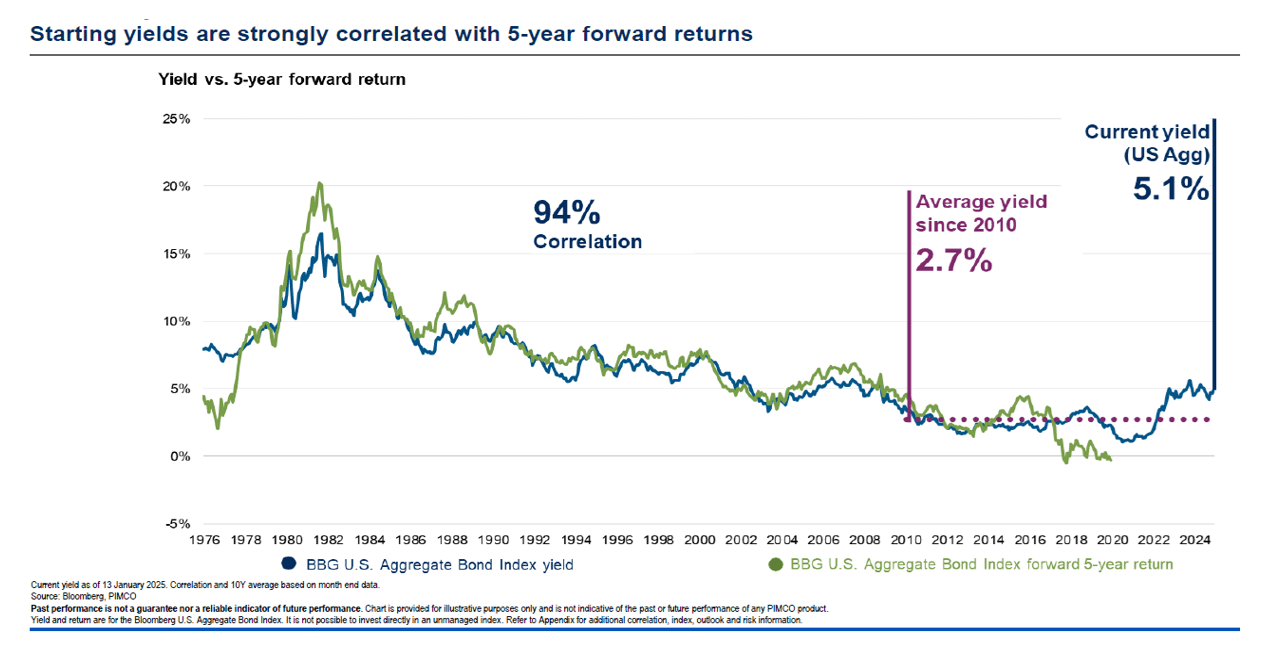
The probability distribution chart is also a good segue to discuss the outlook for bonds. Regular readers of our Outlook will know that we have been bullish on bonds for the better part of two years. We remain so today. When bond yields are greater than 5%, as they are today, core bonds (i.e. the Bloomberg US Aggregate Bond index) have offered a tighter range of outcomes anchored at a higher level. Further, 5-year forward returns on bonds have a very high correlation with their current yield (94%). True—short term returns can vary, but longer-term returns tend to anchor on the starting yield. This is true across all bond categories.

CCR Wealth Management’s highest priority is not to seek for our clients the highest market returns possible, but to seek out the highest probability of achieving their required rate of return to ensure the success of a financial plan. The highest returns possible have historically been embedded in the highest risk corners of the market. But at recent valuations, even the S&P 500 can assume high-risk status, as has happened before.
We have said very little about tariffs, and that’s by design. We stand by our January comments on the subject:
The world is a different place in 2025. We cannot and do not say tariffs won’t become inflationary. But we think it is also true that advisors in Trump’s orbit recognize one of the primary reasons their campaign won the economic argument in November and would be loath to cause much in the way of further price increases on consumers (and voters).
Perhaps we’ve found the political pain-point.
We believe the magnitude of recent equity downside is primarily a product of nose-bleed stock valuations. If it wasn’t tariffs, it would have been something else. We recently took an informal internal survey to identify the cause of the Dot-Com bubble burst. Interestingly…there was no consensus and little mention of Enron or Worldcom. Those two accounting scandals accelerated what began to look like just another dip-buying opportunity. Neither Enron, Worldcom, nor the roughly concurrent 9/11 terrorist attack had anything to do with Dot-Com, or the internet. Nor did the tech stocks of the day engage in accounting fraud. The message is that egregiously high market valuations make markets brittle. We sense the market has changed.
There is ample opportunity for investors to take advantage of. An assumption of lower stock returns ahead should not be an impediment to investing. The “cash or stock” binary choice is a false one. Just review your financial planning return assumption with your advisor and give yourself the best odds of achieving it!
Disclosures:
The views are those of CCR Wealth Management LLC and should not be construed as specific investment advice. Investments in securities do not offer a fixed rate of return. Principal, yield and/or share price will fluctuate with changes in market conditions and, when sold or redeemed, you may receive more or less than originally invested. All information is believed to be from reliable sources; however, we make no representation as to its completeness or accuracy. Investors cannot directly invest in indices. Past performance does not guarantee future results. Additional risks are associated with international investing, such as currency fluctuations, political and economic stability, and differences in accounting standards.
A diversified portfolio does not assure a profit or protect against loss in a declining market.
Registered Representative: Securities and advisory services offered through Cetera Advisors LLC, member FINRA/SIPC, a broker/dealer and Registered Investment Adviser. CCR Wealth Management and Cetera are affiliated. Cetera is under separate ownership from any other named entity.
Follow us on social media for more timely content delivered directly to your news feed!
