April 2024 Market Outlook
Fear and Loathing in the Republic
Every four years we are compelled to include in this Outlook a reminder to investors that allowing your political leanings to overtly influence your investment decisions often ends in disappointment. This election cycle is certainly no exception, though perhaps the temptation may be greater.
In 2024 voters and investors have the unusual, though not unprecedented, choice between two known quantities for President. According to most polls, voters don’t seem too excited about either. How we got here is outside of the scope of this Outlook. Our concern is in the common behavioral tendency among investors to conflate their political outlooks (preferences, leanings, and loathings) with some kind of coherent investment strategy. Over the years, it seems politics in America has become increasingly tribal. As such, emotions run high—and have a strong tendency to color all aspects of how we view the world, including our investment portfolios.
Of course, we are not political scientists, but our sense is that “the middle” in America has grown, not shrunk. How else to account for the fact that there have been more close elections over the last fifty years than political blowouts? It’s the “shrieking” from the 20% or so on either end of the political spectrum that makes it seem otherwise. Among the shriekers, of course, is the media which always stands to benefit from division and drama.
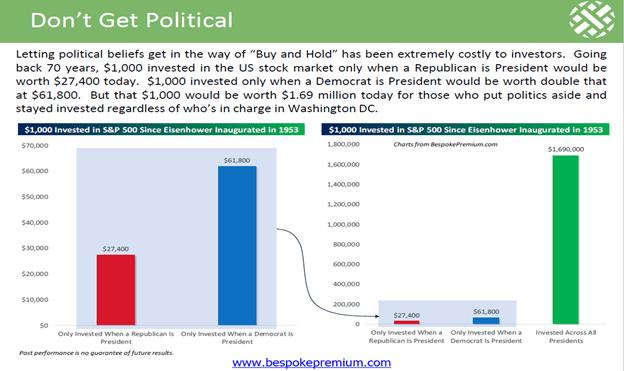
As investors, we must maintain focus not on the drama, but on the hard facts. So, when it comes to politics, election cycles and investing, we hope readers will give more weight to the following facts than the high-volume drama which can obscure them. Additionally, narratives such as “where to invest”, “what stocks” or “sectors” to buy if so-and-so wins the election have their antidote in these facts as well. We lean heavily on the research of Bespoke Investment Group for these facts and illustrations.
Below is the average performance of the S&P 500 per four-year Presidential term going back to the first Roosevelt (FDR) administration, including where markets stood on election day.

While conventional wisdom has it that Republicans are better for the stock market than Democrats, we see that with the Dow Jones Industrial Average, median returns have actually been higher under Democrats (30.9%) than Republicans (22.5%) going back to 1900. But a more nuanced look at the data—annualized returns under each President—shows a slight edge under Republican Presidents (7.9%R versus 7.7%D). Bespoke is also quick with this disclaimer: “Within those median returns, however, there is a ton of dispersion, so countless other factors besides who resides in the White House have a larger impact on the performance of stocks”. Among these other factors, we would add that the Dow is a price-weighted (vs. market-cap weighted) index. Literally, the price per share of constituents in the Dow has a greater influence on its performance than does the party-affiliation of the President.

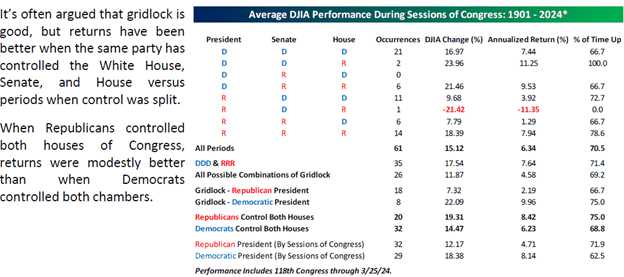
Of course, the Presidency is not the only office up for grabs. Before voting for your preferred party up and down the ballot, digest the following market returns based on the balance of power in Washington.
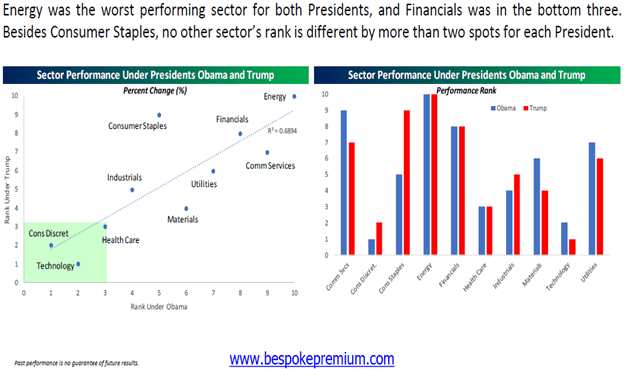
While the Commander in Chief will always take credit for bull markets (and get blamed for bear markets), and much is made in the media about the success/failure, or the electoral prospects of a President/challenger based on the stock market, the truth is that the President’s impact on the markets has been shown to be extremely limited. During the last two administrations (Obama and Trump), who were polar opposites in terms of policy as well as style, we see that sector performance within the S&P 500 was little changed between them. Consumer Discretionary, Technology and Healthcare were the top-performing sectors under eight years of Obama. Under Trump—the same.
Lastly, can stocks predict elections?
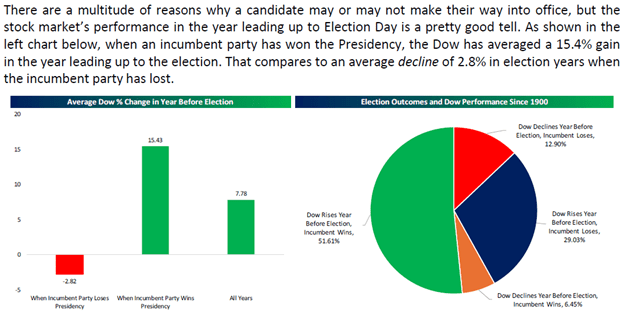
Before you go about rearranging your portfolio or betting on the November election outcome based on the performance of the Dow this year, we would point out one major shortcoming of all this research as well as similar statistics we are likely to be inundated with in the coming months. There have been only 25 Presidential election cycles in the last 100 years. Reaching back to your statistics class lessons, you may recall that to get any statistically meaningful analysis a population of at least 100 observations should be studied. Even if we are looking for representativeness, a minimum sample size of 30 is the lower limit—less than the number of Presidential elections in the last century.
We are not blind to the potential for economic and market impacts that can be traced to policies favored by the President of the United States. Our own view is that our recent bout of inflation is more easily traced to Washington’s fiscal policies, than the Fed’s monetary policies (which had more or less been in place for the prior 13 years). But behavioral finance studies, the data depicted above, and our last several election-year Outlooks have repeatedly shown that portfolio meddling based on electoral politics has scant probabilities of improving your returns. Like him or loathe him, the S&P 500 is up 61.67% since Joe Biden was elected President, and up 40.89% since his inauguration. “Sitting out” based on the 2020 election results has been a costly (yet predictable) mistake. Like him or loathe him, the S&P was up 70.26% from the day Donald Trump was elected President to the day he lost the election to Joe Biden. Sitting out was disastrous.
Outlook:
Inflation is when you pay fifteen dollars for the ten-dollar haircut you used to pay five dollars for when you had hair.
—Sam Ewing, MLB player 1973-1979
We think the biggest development thus far into 2024 has been the arrested decline of inflation, as measured by the Consumer Price Index. Despite the most significant monetary policy tightening in forty years, the economy has maintained a certain momentum, and employment has remained strong. We bring it up again: where has the “pain” Chairman Powel promised us almost two years ago been? The Consumer Price Index rose 3.5% YoY in March, higher than consensus expectations, after having risen more than expected in both February and January (3.2% and 3.1%, respectively).
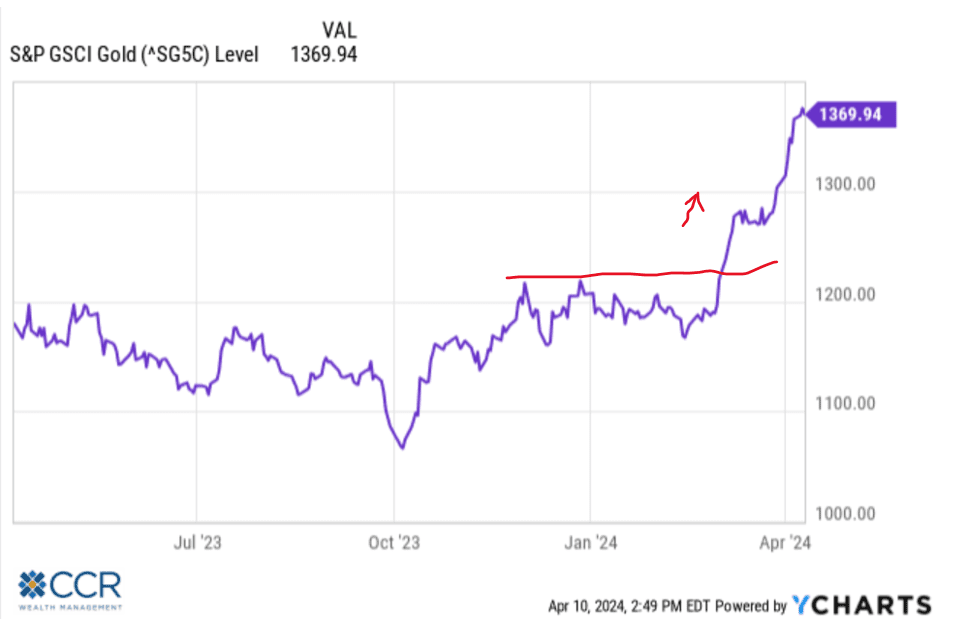
One aspect of inflation’s arrested downward development that has caught our eye is the firming of commodity prices generally, and the significant break-out in gold, more particularly. This is interesting to us given gold’s relatively more benign price action back in 2022, when inflation was soaring. The yellow metal has a reputation for being a hedge against inflation (which we dispute), so its recent blast-off may have investors paying even closer attention to monthly CPI and PCE data going forward.
Along with gold, we have also experienced a resurgent 10-year bond yield. Having peaked at 5% in October, the 10-year yield quickly bottomed two months later to 3.8% but has been re-tracing back upward ever since. In our internal conversations with advisors, we have repeatedly maintained that 5% was too high, and that 3.8% was likely too low.
It is important to point out that in our view, what we are seeing is more reversion-to-the-mean than resurgence in either inflation or interest rates—at least thus far. Like political news coverage, we have seen this market lurch to extremes very quickly (including, and perhaps most especially with last year’s AI mania). The truth is likely somewhere in between, and we think the foundations of the equity markets are sound. But Wall Street’s cheering for rate cuts has definitely been muted. Expectations for as many as seven 2024 rate cuts back in January (to begin in March) have been dashed. More recent confidence of an easing cycle beginning in June also now seems to be off the table.
The implications of this are not at all clear—as has been usual in this cycle, opinions are widely dispersed. Our own expectations include a continued stall in the bond market recovery, and likely vulnerability in equity names which have exhibited the largest degree of momentum in recent quarters—semiconductors and consumer discretionary names are among this group.
But this is a classic “on the one hand…on the other” scenario. Chairman Powell has repeatedly insisted over the last year that financial conditions are “restrictive”, the condition needed to bring inflation to heel. Indeed, 550 basis points of rate hikes since March 2022 brought caution to our own Outlook last year. Over two years since the first hike, however, we live in a world where unemployment hovers near historical lows, consumer spending has remained robust, credit spreads have never been tighter, and equities hover near historical highs. We ask again, where’s the pain? Indeed—we should all be asking what Powell’s definition of “restrictive” monetary policy is. We admit this is an outlier—but might there be further rate hikes ahead? Not likely in an election year, but not unheard of either.
Speaking of equities (and mean reversion)—a secondary development which has been going on for about 6 months, but has in some cases accelerated in Q1 has been the disintegration of the Magnificent 7 stocks. The M7 was a powerful trading block last year which provided most of the S&P 500’s return through much of last year. We’re now down to the “Fab 4”, as 3 of the 7 underperform the S&P over the
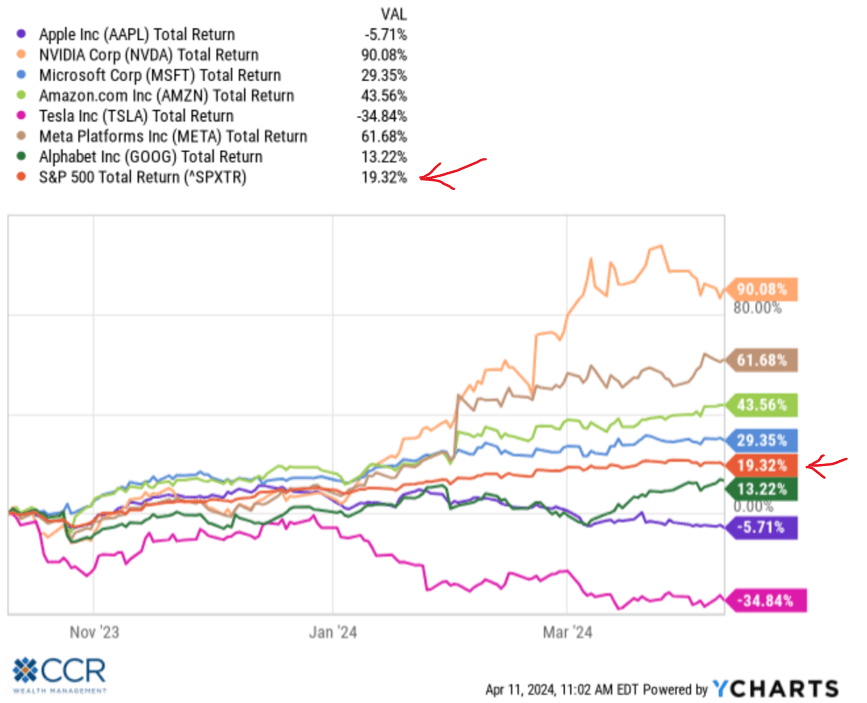
last six months, with two of the issues being negative in this period. Mean reversion is the natural phenomenon that distributions of returns eventually return to their long-term averages. As such, we expect a continued distinction in returns among the constituents of this trading block from one another, and a lessening of the distinction in returns of the block itself from the rest of the broader average components in the quarters ahead. Recall that the last bout of inflation fears in 2022 had this block down 16.41% before the Fed even made their first interest rate hike. Now that the certainty of rate cuts is fading fast, further reversion to the mean is a reasonable expectation.
At this point we would normally move on to discuss bonds and their outlook. But we’ve already spoiled the lead announcing our expectations of a “stalled” bond market rally. “Stalled” does not mean “ended”, per se. But the discussion of bond yields—still attractive in our view—should be accompanied by an examination of their relativity to cash.
In the Summer and Fall of 2022 we experienced the phenomenon of cash instruments (CD’s, money markets, T-Bills) paying annualized yields first in excess of 4%, and soon thereafter, in excess of 5%. This was an increase in yield of over 200% for cash instruments in only 9 months from the beginning of 2022. Of course, simultaneous with this new debut of higher rates (guaranteed in some form by the US government), equity markets were in negative territory by double digits, and the Bloomberg US Bond Index was giving equities competition for lousy returns. Investors sought respite from this tumult with the novelty of higher savings rates, predictably, “selling low” to make the transition.
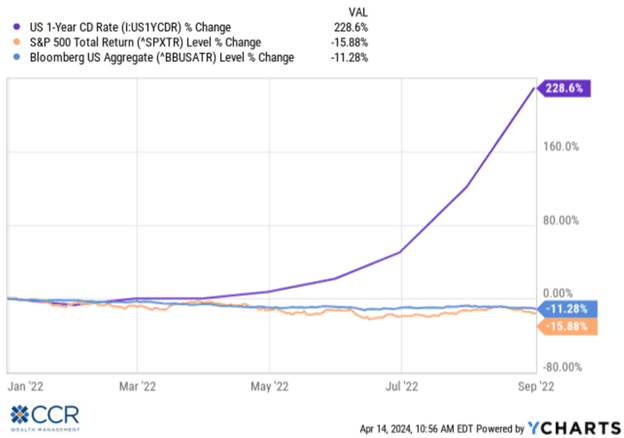
No doubt, for many it felt good to find a port in the storm—especially one that was going to pay you more on cash than what had been available for well over a decade. While inflation was peaking at over 9%, some investors were choosing a “known loss”, in real terms of 4% by locking into a 5% yield (cash yield - inflation rate = the “real” yield). As the yield curve remains inverted, even today, these short terms rates are still with us. Recent inflation data may have extended their shelf-life, to boot.
Unsurprisingly, investors who made the volatility-averse decision to swap stocks for cash instruments twenty or so months ago have perhaps some reason for regret. While 5% or more on cash is nice, since September 1st, 2022, the S&P 500 is up over 32%—having pushed into new-high territory back in December.
Of course, real cash returns have gone from negative to positive over this period as the rate of price increases in the economy has declined, from about -4% to + 1 ½% (sticking with our 5% cash yield minus CPI rate example). The feared resurgence of inflation, however, threatens to reverse this trend. Investors should always be mindful that cash yields are relative. The novelty of 5% does not always imply a positive real return.
But cash returns relative to bonds is a more complex story. Like stocks, bonds have two components to their total return: the cash yield they pay every year, +/- the price return. Bonds today have a significant yield component in relation to recent history (and in relation to stocks). Going out on the yield curve—despite its inversion—can mean picking up significant yield over cash. For example, investors may attain bond yields well in excess of cash yields in the government backed mortgage market. Adding some credit risk may also improve bond portfolio yields relative to cash. But because bond prices are sensitive to interest rates, bond portfolio total returns (yield plus price move) can be complex in the short run. In short—much of the bond market currently expresses yields well in excess of inflation, but there can be an element of short-term downside to the value of bonds prior to their maturity. In contrast…cash has no downside other than the potential erosion of purchasing power owing to inflation. “Opportunity cost”, the price paid by investors who decided a 5% yield on cash outweighed the risk of their asset allocation’s potential returns over the last two years, should come into sharper focus when the future purchasing power of their money is under assault.
From a portfolio perspective, it is important to examine why anyone exposes their hard-earned money to risk at all. We recall early in our career the answer to this question was reflexive. The prior decades provided us with a vivid lesson on the impact inflation’s thievery—something that then was top-of-mind for most investors. Diversified portfolios were designed by investors primarily to combat this thief.
Back to bonds: Since the crescendo of market volatility back in 2022, stocks (S&P 500) have returned about 47%. We usually measure the bond market with the Bloomberg US Aggregate Bond Index, which is up about 8% over this same period. But 8% annualized over 18 months (~5.2%) barely keeps pace with the average CPI print month-over-month. Our own model bond portfolio(s) have generally done much better, with the “core” bond holding returning about twice the Bloomberg average over this period, as well as longer term. While past performance cannot be relied on to repeat, the primary difference between our core holdings and the index, by definition, is active management.
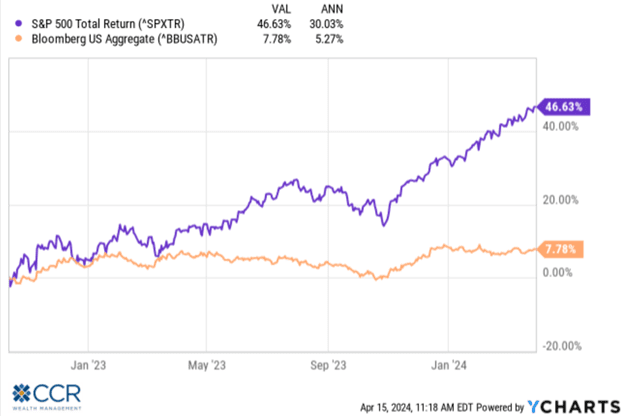
The bond market contains much more complexity than a simple yield calculation in time. Portfolio returns are measured in total return terms, as has been discussed before. Ignoring the price component—and its dynamism—relegates you (locks you in) to the yield alone, like cash, which can be disadvantageous when the whiff of inflation is in the air. Bond sector rotation, new issuance, credit conditions, interest rate volatility, convexity and economy of scale (for bond buyers & sellers) all play important roles in the total return of bond portfolio managers. As is discussed in CCR Wealth Management’s Investment Philosophy, the bond market is also one of the most inefficient capital markets in the investment universe, marked by liquidity constraints, opaque pricing and bid/ask spreads.
All these limitations define a market where “mispricings” happen regularly, and spell opportunity. As such, skilled management usually has an easier time outperforming the broader market (unlike, say the S&P 500 which is perhaps the most efficient market in the world, and is notoriously difficult to outperform consistently for managers who seek to compare to this benchmark). Risks are involved in any securities investment, and investors should make every effort to understand them. Our point, as wealth managers is that the primary risk we all seek to combat is inflation—whether you are an investor or not. Losing sight of opportunity costs and portfolio real returns due to the novelty of higher cash yields can exacerbate this risk.
Please do not hesitate to reach out to your CCR Wealth management financial advisor if you have questions about commentary in this Outlook, or to discuss your own portfolio or financial planning concerns.
Follow us on social media for more timely content delivered directly to your news feed!
