
July 2026 Market Outlook
Executive Summary
Persistent geopolitical and economic uncertainty, especially regarding ongoing Middle East tensions and skepticism over recent agreements with Iran, has remained a key concern for investors. Elevated oil prices and depleted global petroleum reserves are fueling inflation, prompting a shift in Federal Reserve policy from rate cuts to a more hawkish stance. Despite these headwinds, the S&P 500 rose over 10% in the first half of 2026, although gains are concentrated in semiconductor stocks, raising concerns about index concentration and sector risk.
CCR retains a cautiously optimistic outlook, advising investors to remain vigilant and diversify amid market volatility and ongoing geopolitical risk. Our investment team foresees improving opportunities in small-cap, value, energy, healthcare, and financial stocks while maintaining that broader market fundamentals continue to support a bullish long-term outlook.
Outlook
In our opening comments from the April Outlook, we expressed skepticism at the prospect of “a deal” being struck with Iranian counterparts—whoever they may be these days.
Color us skeptical that this settles anything from a geopolitical standpoint. This war has been going on for nearly 50 years. We doubt it ends in negotiation.
When that was written, there wasn’t even a “memorandum of understanding” in place, but the air was thick with talk of cutting a deal with Iran to achieve our aims and to halt the bombing. The MOU came in June. Thereby, the United States began to cede momentum and strategic and kinetic advantage in this contest of wills, returning us to the state of play that has existed for at least the last thirty years. “Deals” being cut with counterparts who have no intention—or history--of honoring “deals”. Checkers and Chess.
This is an investor newsletter, so the message is this: prognostications that “oil is back to its pre-war levels” and, therefore, our GDP estimates are XYZ should be ignored. Indeed, the air was thick with these auguries for much of the second quarter as oil retreated from its spiked highs in early April. Oil prices, relative to where they have been over the last few years (as low as $60/barrel but averaging just over $70), will remain elevated for the foreseeable future. Not only will the Hormuz issue likely be with us for the long term, but countries around the world, including our own, have significantly drawn down strategic petroleum reserves over the past 5 years—most of which was done to combat the 2022 spike in inflation.
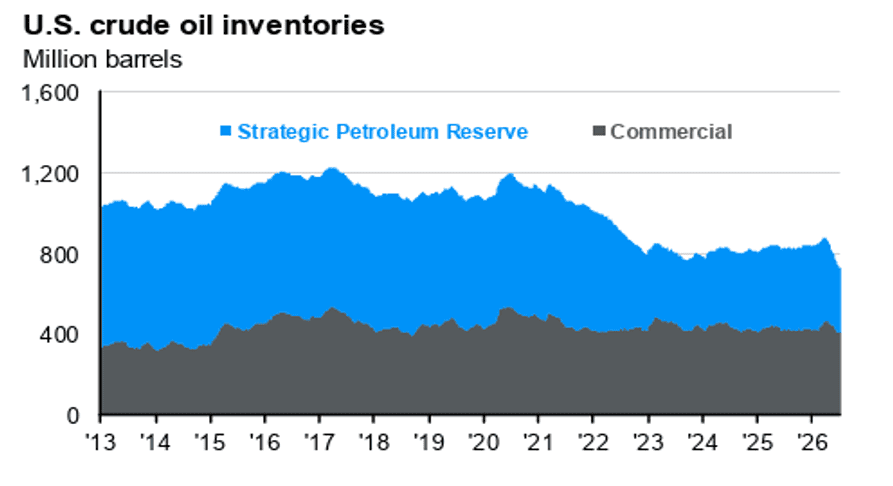
Source: FactSet, J.P. Morgan Asset Management; (Top and bottom left) EIA.
Military tensions and conflagrations around the world, from Eastern Europe to the Taiwan Straits to the Middle East, underscore the necessity of addressing these depletions.
This strategic asset needs to be replaced (globally) and represents an additional source of demand for energy apart from day-to-day requirements of a growing economy…which only grows further with the development of power-hungry AI development. Elevated energy prices directly feed into inflation data and future inflation assumptions. In turn, inflation data and assumptions are part of what has shifted the tilt of both the Fed and Wall Street this year from a bias toward rate cuts to one expecting rate hikes. As you can see, higher oil prices were a significant component of May’s 4.2% print on CPI. While prices came down in June (due in large part to the MOU chimera) and CPI’s reading reduced to 3.50%—we’re officially back at war as of mid-July—and Brent Crude is up 13%-15% in just the last week to ~$86/barrel.
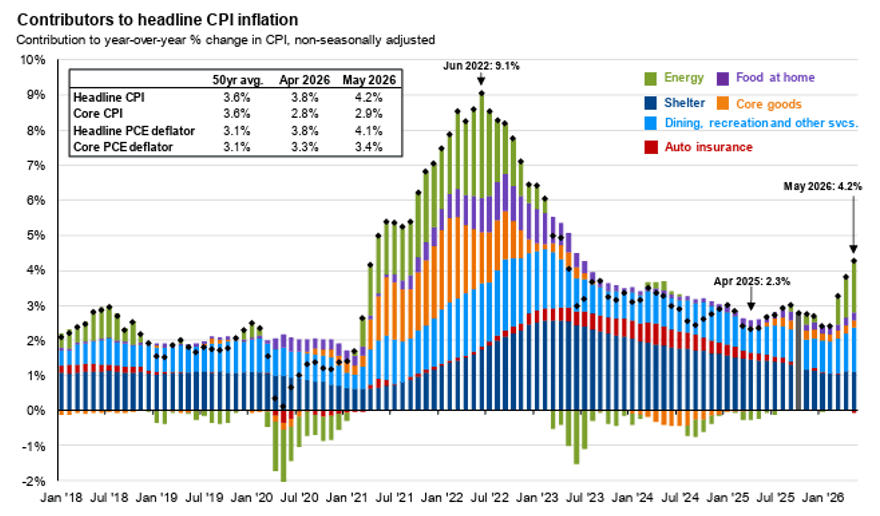
Source : BLS, FactSet, J.P. Morgan Asset Management. [1]
In short—we think it is far too early to harbor assumptions of pre-war oil stability and inflation falling toward the Fed’s target. June’s drop in CPI was just a single data point reflecting “MOU” optimism, which is now in the rear-view mirror.
“Wall Street climbs a Wall of Worry”—words branded into us at an early stage in our career. Without worry—the market would likely swoon significantly. When everyone is on the same page, so to speak, then everyone has already bought. Demand dries up, and there is then nothing left to do but sell and book profits—or so the thinking goes. There’s always something to worry about, it seems (which is why most markets are bulls, not bears). This year has been no exception.
We have lurched from the invasion of Venezuela, panic that the software sector is being destroyed by AI, concern about “hyperscalers” tapping the capital markets (marring once-pristine balance sheets), dovish interest rate outlooks becoming hawkish, stubborn inflation, new leadership at the Federal Reserve, protracted military conflict in the Middle East, oil price spikes (and general volatility), the inflation of a bubble in semiconductor stocks (and its subsequent deflation), and oh yes—it’s an election year! Good thing there’s been plenty to worry about! Stay bullish!
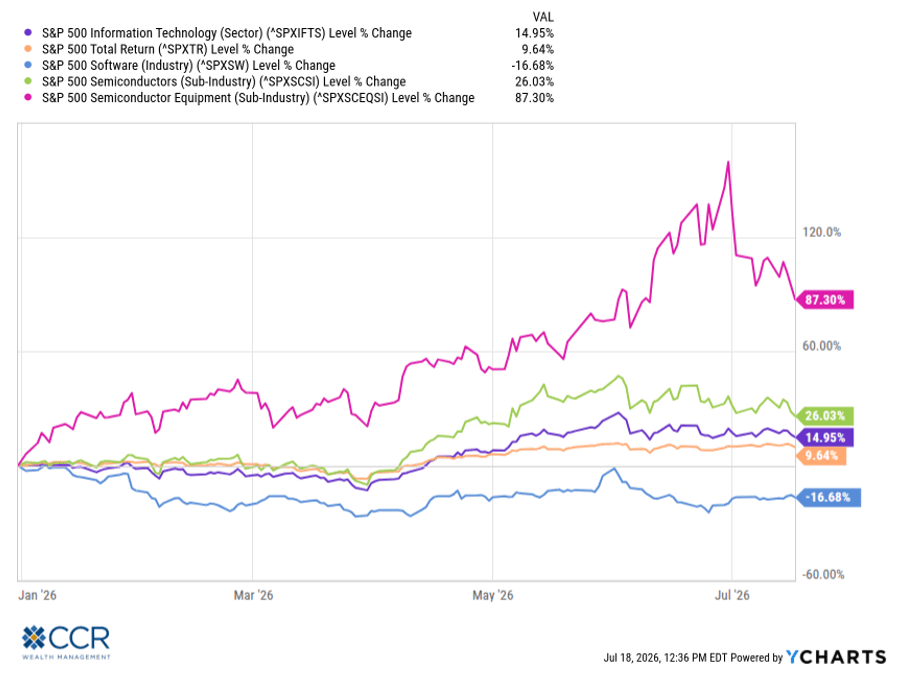
The S&P 500 climbed this Wall of Worry to finish up 10.21% by the mid-point of the year.
For investors who jumped on the Mega-Tech bandwagon in the last few years, now might be a time for introspection. While the information technology sector of the S&P 500 shows a positive return of 14.95% (as of mid-July) and is outperforming the S&P 500, six of the seven largest companies in the index (all tech or tech-adjacent) have returns below that of the S&P 500. Three of them are negative through mid-July, with two deeply so (-15.32% and -18.57%). Meanwhile, chipmakers now account for an astounding 41.9% of the S&P tech sector and 19.7% of the S&P 500 (up from 25% & 12%, respectively, just back in April, as we pointed out then). Semis, then, account for essentially all of the tech sector’s year-to-date performance and then some, as well as that of the S&P 500. Index investors should be particularly aware of this imbalance.
CCR’s Outlooks over the last year have had an intentional focus on the benefits of portfolio diversification. Note that a simple 60/40 asset allocation comprising the S&P 500 (60%) and the Bloomberg Aggregate Bond index (40%) has returned about 6.00% year-to-date through mid-July.
As seen below, a portfolio more diversified across market caps and non-US equities fares significantly better, at about 9.5% over the same period. We continue to appeal to your greed, not your fear, by harping on diversification.
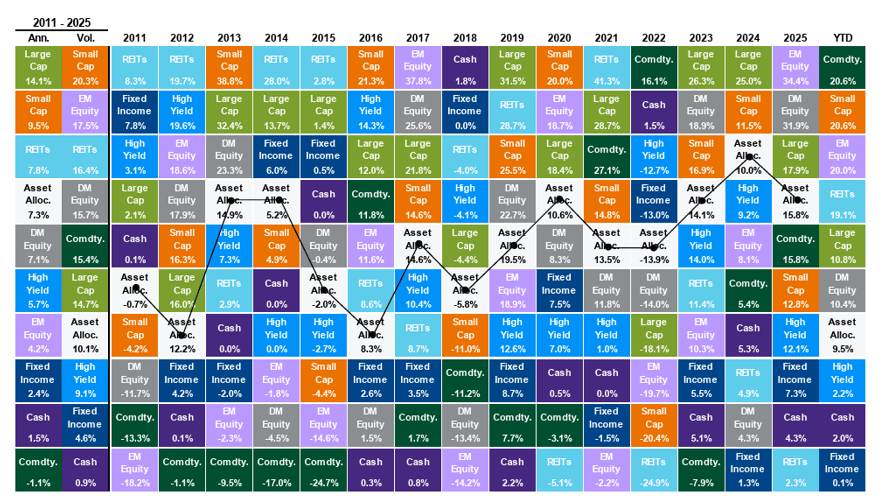
Source: Bloomberg. FactSet, MSCI, NAREIT, Russell, Standard & Poor's, JP. Morgan Asset Management. [2]
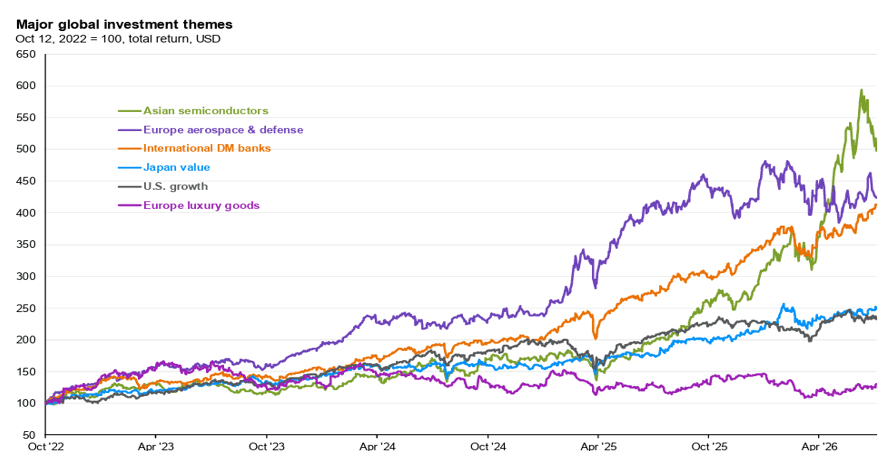
While AI is a global investment theme—not just an American one—investing overseas exposes investors to other, concurrently powerful themes that, since the start of the current bull market in late 2022, have largely augmented, not detracted from, the US growth story. Additional benefits include markets that are much less concentrated (it is difficult to think of the S&P 500 as a diversified index these days) and much less expensive on a valuation basis.
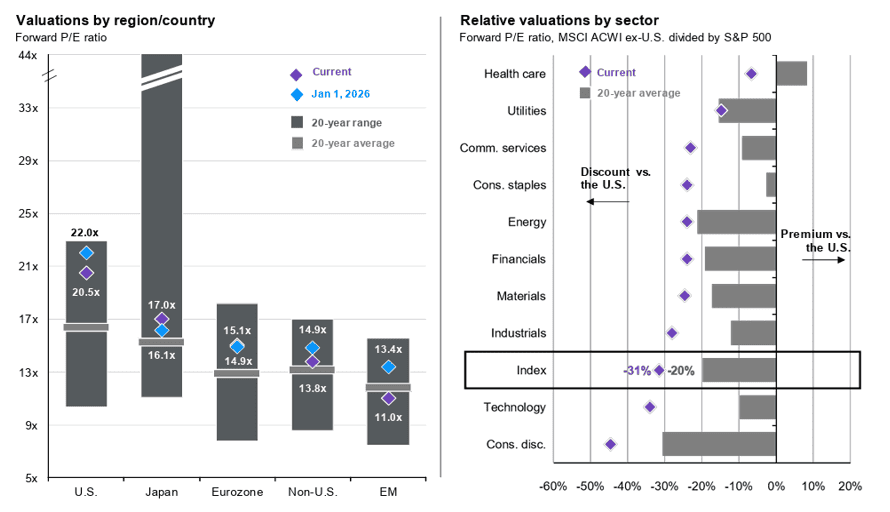
Source: FactSet, MSCI, Standard & Poor's, J.P. Morgan Asset Management. [4]
And lastly, large-cap US tech-concentrated portfolios, which arguably are most portfolios, continue to lose out to small caps, value, energy, and, more recently, healthcare (pharma & biotech) and financials (banks), which have broken out to new highs.
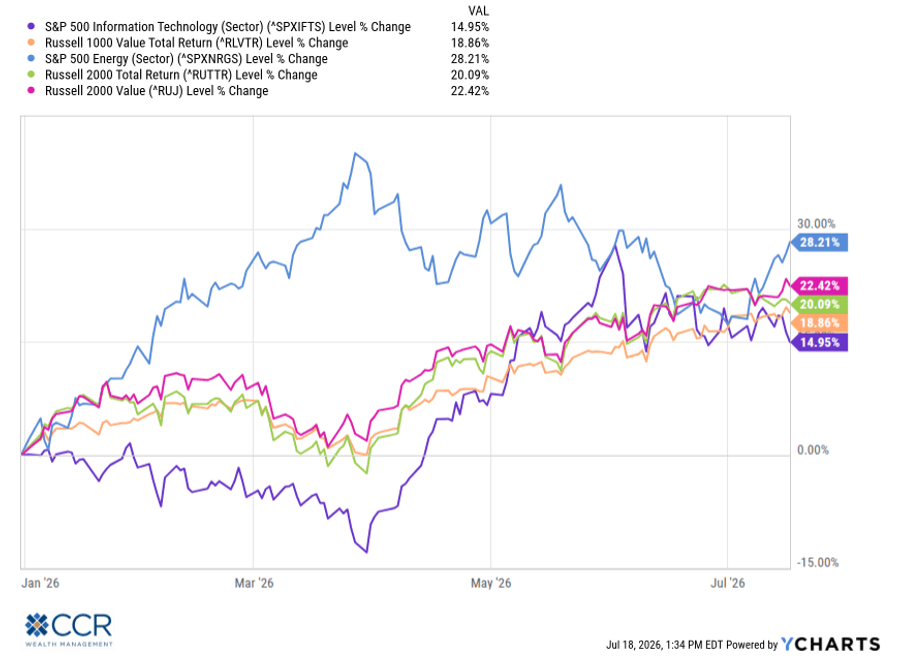
We have conviction that the top is in in the semiconductor group (it happened in late June), and that rallies (they will happen) will be sold into rather than piled onto. One clue is how investors have responded to record-shattering earnings releases and bullish forward guidance: 10%-20% selloffs. Another is the inflow into healthcare, financial, and energy ETFs and stocks, concurrent with outflows from semis. Given chipmakers’ contribution to broader market returns thus far this year, if our conviction is justified, it could be a drag on broader market returns. Something else to worry about!
But despite the “Wall of Worry” enumerated in these pages, CCR Wealth Management is bullish! We will close by citing three reasons we think this outlook is justified:
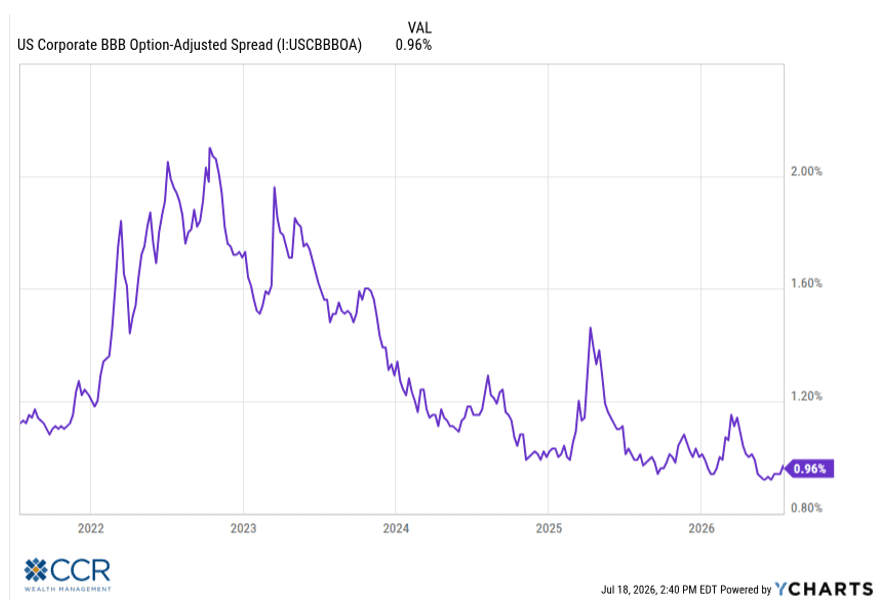
- Credit markets, as measured by the spread between credit yields and guaranteed US Treasury yields, remain as tight as ever. This occurs amid concerns that major companies are blowing through their positive cash flows and tapping the debt markets to fuel a capital spending spree on chips and data centers. A tech spending frenzy not seen since the late 1990s. It also occurs despite the jitters we enumerated in April about the private debt markets… so far, things appear contained. Healthy (narrow) credit spreads are symptomatic of healthy Wall Street animal spirits.
- Earnings have remained strong: Aggregate S&P 500 earnings growth is tracking at approximately 26% yoy, growth rates not seen since 2021 (according to Google’s Gemini).
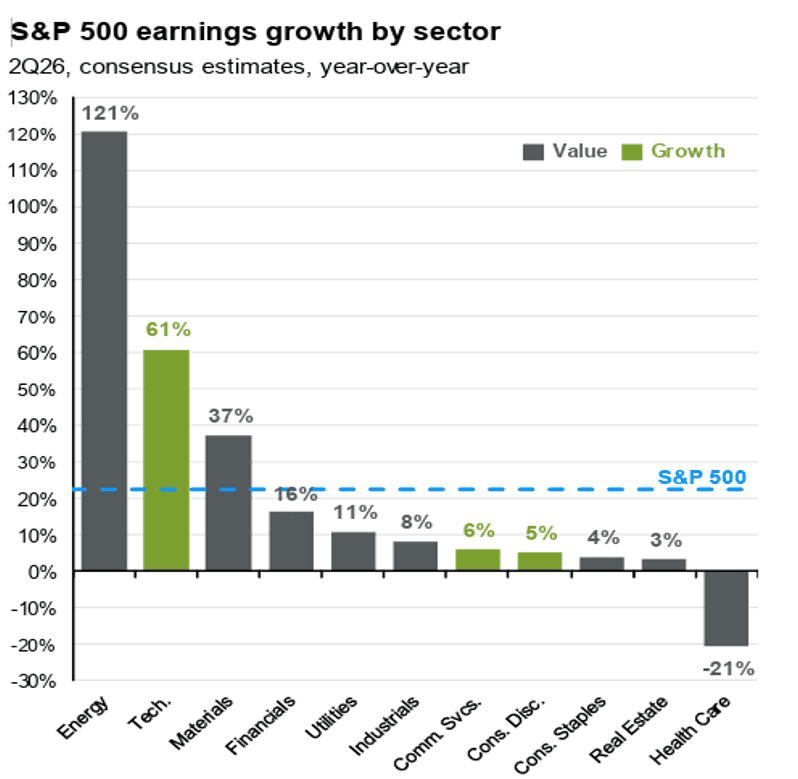
Source: FactSet, FTSE Russell, Standard & Poor's, J.P. Morgan Asset Management. [5]
- The S&P 500 is up 9.64% through mid-July. And yet—the S&P 500 P/E ratio has declined! We ended 2025 with a trailing P/E ratio of 26x earnings, which today sits at about 25.27x earnings. This is despite the numerator being up 9.64% — which underscores the strong growth in the denominator (earnings). Keep in mind that we are not implying that US markets are cheap; they are not! But earnings are justifying current levels presently.
CCR Wealth Management manages a number of differentiated model portfolios and strategies. We welcome regular discussions with all our clients to review your portfolio characteristics, diversification metrics, and market expectations. Please contact your CCR financial professional if you have questions or would like to examine your portfolio diversification characteristics.
Disclosures:
The views are those of CCR Wealth Management LLC and should not be construed as specific investment advice. Investments in securities do not offer a fixed rate of return. Principal, yield and/or share price will fluctuate with changes in market conditions and, when sold or redeemed, you may receive more or less than originally invested. All information is believed to be from reliable sources; however, we make no representation as to its completeness or accuracy. Investors cannot directly invest in indices. Past performance does not guarantee future results. Additional risks are associated with international investing, such as currency fluctuations, political and economic stability, and differences in accounting standards.
A diversified portfolio does not assure a profit or protect against loss in a declining market.
Sources:
[1] Contributions mirror the BLS methodology on Table 7 of the CPI report. Values may not sum to headline CPI figures due to rounding and underlying calculations . “Shelter” includes owners’ equivalent rent, rent of primary residence and tenants’ and household insurance . “Food at home” includes alcoholic beverages . Headline and core PCE deflator inflation shown are based on seasonally adjusted data due to data availability . Official October 2025 data unavailable due to government shutdown and data shown are J.P. Morgan Asset Management estimates . Guide to the Markets – U.S. Data are as of June 30, 2026.
[2] Large Cap: S&P 500: Small Cap: Russell 2000: EM Equity: MSCI EME: DM Equity: MSCI EAFE; Comdty: Bloomberg Commodity Index High Yield: Bloomberg Global HY Index Fixed Income: Bloomberg U.S. Aggregate: REITs: NAREIT Equity REIT Index Cash: Bloomberg 1-3m Treasury. The "Asset Allocation" portfolio is for illustrative purposes only and assumes annual rebalancing with the following weights: 25% in the S&P 500, 10% in the Russell 2000, 15% in the MSCI EAFE, 5% in the MSCI EME, 25% in the Bloomberg U.S. Aggregate, 5% in the Bloomberg 1-3m Treasury, 5% in the Bloomberg Global High Yield Index, 5% in the Bloomberg Commodity Index and 5% in the NAREIT Equity REIT Index. Annualized (Ann) return and volatility (Vol) represent the period from 12/31/2010 to 12/31/2025. Please see the disclosure page at the end for index definitions. All data represent total return for stated period. Past performance is no guarantee of future results. Guide to the Markets -U.S. Data are as of July 16, 2026.
[3] 10/12/2022 was the market bottom for U.S. equities. Europe aerospace & defense = MSCI Europe / Aerospace & Defense Index, Asian semis = FactSet Market Indices Asia / Semiconductors Index, International DM banks = MSCI EAFE / Banks Index, U.S. Growth = Russell 1000 Growth Index, Japan value = MSCI Japan/ Value Index, Europe luxury goods = MSCI Europe/Textiles & Apparel & Luxury Goods Index. Past performance is no guarantee of future results. Guide to the Markets -U.S. Data are as of July 16, 2026.
[4] Countries are represented by their respective MSCI country index except for the U.S., which is represented by the S&P 500. Guide to the Markets - U.S. Data are as of July 16, 2026.
[5] Growth is represented by the Russell 1000 Growth Index and value is represented by the Russell 1000 Value Index (Top right) Graph was made by ranking the S&P 500 constituents by total return. (Bottom right) Long-term averages are calculated monthly since December 1997. Past performance is no guarantee of future results. Guide to the Markets - U.S. Data are as of July 16, 2026.
Follow us on social media for more timely content delivered directly to your news feed!